

If you are building cultivated meat processes, metabolic pathway mapping helps you decide what to feed, when to feed it, and what sensors to use before cell state drifts.
I’d boil the article down to this: proliferating and differentiating cells do not run the same metabolism, and that shows up in nutrient uptake, waste output, oxygen demand, and product traits. The piece also makes a second point: pool-size metabolomics is not enough on its own. If I need to know where carbon is going, I need isotope tracing, flux analysis, and a genome-scale model that I can test against wet-lab data.
Here’s the short version of what the article covers:
- Four lineages: bovine satellite cells, porcine skeletal muscle stem cells, chicken myoblasts, and mesenchymal stromal cells
- Main pathway shift: proliferation leans more on glycolysis; differentiation leans more on mitochondrial oxidative phosphorylation
- Key pathway groups: central carbon, amino acids, nucleotides, and lipids
- Useful readouts: lactate, ammonia, amino acid uptake, intracellular metabolites, NAD⁺/NADH-linked state changes, and spent-media markers
- Flux tools: ¹³C tracing and metabolic flux analysis to separate pool size from turnover
- Data quality controls: matched passage number, defined sampling stages, fast quenching, and medium-background correction
- Model layer: genome-scale metabolic models, including the bovine model BtaSBML2986 published in December 2024
- Process use: media design, feed timing, batch vs fed-batch vs perfusion decisions, line selection, and QC
A few numbers stand out. In porcine skeletal muscle stem cells, one study reported 94 intracellular metabolites, with 24 stage-linked to proliferation and 17 stage-linked to differentiation. That is not random variation. It points to a clear state change that you can measure and use.
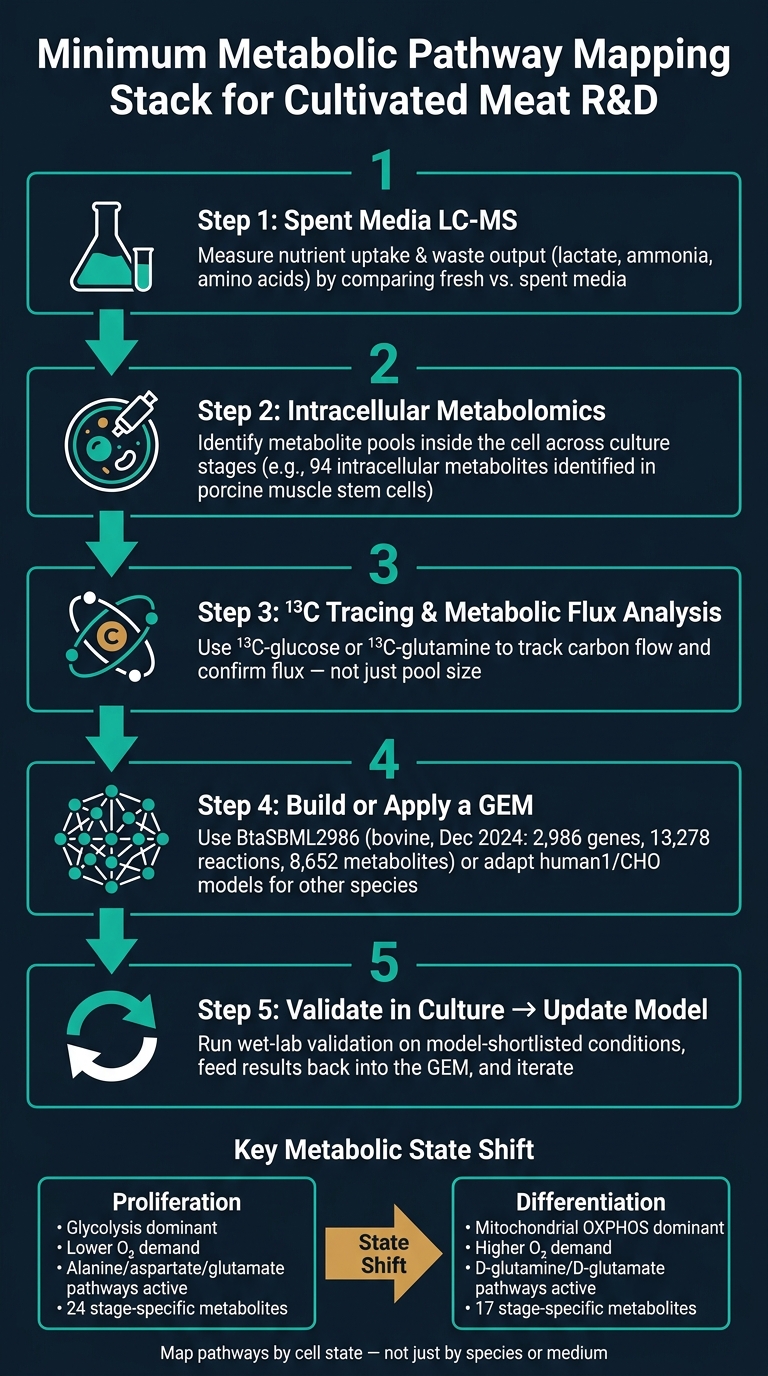
I’d use this article as a guide for a minimum mapping stack:
- Start with spent media LC-MS
- Add intracellular metabolomics
- Use ¹³C-glucose or ¹³C-glutamine tracing when pool data is not enough
- Put the data into a GEM
- Test the model in culture, then update it
That is the main message: map pathways by cell state, not just by species or medium, and link the data directly to feed design, scale-up, and QC.
If you work in bioprocess, cell culture, or cultivated meat R&D, this article gives you a clear route from pathway biology to day-to-day process decisions.
Metabolic Pathway Mapping Stack for Cultivated Meat R&D
Core metabolic pathways in cultivated meat cell lines
Central carbon metabolism: glycolysis, TCA cycle, and oxidative phosphorylation
In proliferating cells, glycolysis does two jobs at once: it supplies ATP and feeds biosynthesis with carbon intermediates. Creatinine in proliferating cells points to fast creatine-phosphate turnover, which helps buffer ATP demand [3].
As cells commit to differentiation and start forming myotubes, that metabolic setup changes. Oxygen consumption goes up, cytochrome c oxidase activity increases, and mitochondrial oxidative phosphorylation becomes the main ATP source [3]. The TCA cycle sits at the centre of this shift. It links ATP production with amino acid metabolism and provides intermediates needed for growth and myogenic development [3]. The NAD⁺/NADH ratio is a useful readout here: a higher ratio suggests more active oxidative metabolism [3]. Put simply, differentiation comes with a higher oxygen requirement.
This same change in state also alters amino acid, nucleotide, and lipid demand.
Amino acid, nucleotide, and lipid metabolism
Amino acid demand changes across the culture period. During expansion, alanine, aspartate, and glutamate metabolism support biomass accumulation [3]. During differentiation, D-glutamine and D-glutamate metabolism become more prominent and help support synthesis of contractile proteins such as myosin and actin [3].
Nucleotide demand is highest during proliferation, when cells need DNA and RNA synthesis to support division. Pools then increase during differentiation to support myofibre formation [3].
Lipid metabolism also shifts. Lysophosphatidylethanolamine (LysoPE) and lysophosphatidylcholine (LysoPC) are detected specifically during differentiation [3]. These lipids support membrane remodelling during myoblast fusion, which makes sense when cells are moving from growth into tissue formation.
Tryptophan metabolism also stands out. Its downstream product indolelactate acts as an antioxidant during differentiation and helps protect cells from oxidative stress during myotube fusion [3]. That matters for final product quality because stable myotube formation supports the structural integrity of cultivated meat tissue.
How metabolism differs across cell states and lineages
A multi-omics study of porcine skeletal muscle stem cells identified 94 intracellular metabolites, with 24 differentially abundant metabolites unique to proliferation and 17 unique to differentiation [3]. That is a clear metabolic split, not background noise. The same cell type runs different biochemical programmes depending on stage.
Primary vs immortalised cell lines differ in their metabolic stability, and passage number adds another variable. In porcine muscle stem cells, passage 2 usually shows the highest growth rate, while passage 3 shows a marked loss of myogenic marker gene expression along with shifts in metabolite abundance [5]. If all passages are treated as metabolically equivalent, media design and process control can drift away from the state the cells are actually in.
These shifts are summarised below [3].
| Feature | Proliferation State | Differentiation State |
|---|---|---|
| Primary energy pathway | Glycolysis | Mitochondrial oxidative phosphorylation (OXPHOS) |
| Key amino acid pathways | Alanine, aspartate, and glutamate | D-glutamine and D-glutamate |
| Stage-specific metabolites | Aminoadipic acid, creatinine | Indolelactate, LysoPE, LysoPC |
| Oxygen demand | Lower | Higher |
Proliferative and differentiated states show distinct uptake and secretion patterns, so a single metabolic map will not fit every process state [1][2]. These pathway signatures define the readouts used in metabolomics and flux analysis.
sbb-itb-ffee270
Experimental workflows for mapping metabolic pathways
Metabolomics and spent media analysis
Once the key pathways are defined, the next step is to measure them directly.
Spent media analysis is usually the first practical readout of pathway behaviour. By comparing fresh and spent media, you can see which nutrients cells take up and which by-products build up. Targeted LC-MS or GC-MS workflows work well for this, especially when tracking lactate, ammonia, and other core nutrients. These readouts give you a direct view of culture demand and stress.
Spent media can also act as a QC marker. In porcine skeletal muscle stem cells, γ-glutamyl-L-leucine, cytosine, and ketoleucine were strong markers of suboptimal proliferation [5]. Intracellular metabolomics gives a more direct view of pathway activity inside the cell. A UHPLC-Q-Exactive Orbitrap mass spectrometry workflow applied to porcine skeletal muscle stem cells identified 94 intracellular metabolites across myogenic progression stages [3].
Pool sizes tell you what is there; tracing tells you what is moving.
Stable isotope tracing and metabolic flux analysis
Concentration data alone has a basic limit: it tells you the size of a metabolite pool, not how fast that pool turns over. A metabolite can look abundant while doing very little, or look scarce while cycling fast. Metabolic flux analysis (MFA) deals with this by using ¹³C-labelled substrates, such as glucose or glutamine, to trace where carbon actually goes [6].
Use flux analysis when you need to know whether glucose or glutamine is supporting energy production, biomass formation, or both. When ¹³C-labelled glucose is supplied to proliferating cells, the label spreads across glycolytic intermediates, TCA cycle metabolites, and downstream biosynthetic products in patterns that show which branch points are active. During differentiation, the same tracer can quantify the shift towards oxidative phosphorylation. That difference matters for media and feed strategy design. If amino acids are being burned for energy instead of being used for biomass synthesis, the formulation of a differentiation medium needs to change [2][6].
Use MFA when media design depends on flux rather than pool size.
Experimental design choices that affect data quality
The value of both approaches depends on how samples are collected.
Sampling design determines whether the data can be interpreted with confidence. Passage number needs to be matched across samples. In porcine skeletal muscle stem cells, passage 2 usually represents peak proliferation, while passage 3 shows measurable loss of myogenic marker expression and lower proliferation [5]. Treating all passages as if they are the same adds systematic error to comparative analysis.
Samples should also be taken at defined stages: early proliferation, confluence, early differentiation, and myotube formation [3]. In 2D culture, day 2 to day 3 is usually the last reliable window before contraction stress starts to destabilise myotubes [3]. Scaffold-based and 3D systems extend that window and are needed if you want to study longer-term muscle maturation and structural integrity [3].
Quenching is critical for intracellular samples. Metabolic activity has to stop fast at the sampling point, or enzymes will keep converting metabolites after harvest and distort the snapshot. Media background subtraction matters just as much. Spent media should be compared against the same batch of fresh medium so you can separate true cellular secretions from compounds that were already present in the medium.
Computational models and data integration for decision-making
Genome-scale metabolic models and constraint-based analysis
Once pathway data have been measured, GEMs turn those data into predictions that can steer media and process design. Genome-scale metabolic models provide a mathematical framework for mapping a cell’s metabolic network. They usually begin with genome annotation, then improve when aligned with transcriptomics, proteomics, and measured biomass composition at steady state [1]. For cultivated meat cells, GEMs can help with media selection, bottleneck prediction, and condition-to-condition comparison.
Flux Balance Analysis (FBA) and Metabolic Flux Analysis (MFA) are often used to predict intracellular flux and flag limiting media components [1][6]. That makes them directly useful for serum-free media optimisation [1].
In December 2024, researchers from KAIST and CJ BIO Research Institute published the first bovine-specific GEM, BtaSBML2986, with 2,986 genes, 13,278 reactions, and 8,652 metabolites [4]. The model was validated against bovine satellite cell growth across six culture conditions [4]. In practical terms, that gives teams a species-matched starting point for bovine cell line selection, media design, and condition screening.
When no species-specific GEM exists, researchers often start with an existing model such as human1 or CHO GEMs, then refine it with species-specific annotation [1][4]. It’s a sensible workaround: use what already exists, then tighten the fit to the biology you actually care about.
Combining metabolomics, transcriptomics, and proteomics
Integrating transcriptomics, proteomics, and metabolomics links enzyme abundance with metabolite pools and can expose bottlenecks that single-omics datasets miss [1][2]. That matters in cell culture, where a change in gene expression alone doesn’t always tell you what the network is doing. A pathway may look active at the transcript level, yet still stall because enzyme abundance or metabolite availability says otherwise.
Model-guided media optimisation versus experimental trial-and-error
Trial-and-error is easier to get started with because it only needs basic growth metrics. That makes it useful for early screening. But each condition still takes a full culture cycle, and the output is empirical rather than mechanistic [1].
Model-guided optimisation asks for more upfront: genome annotation, -omics data, and measured biomass composition. But once a working GEM is in place, you can screen thousands of formulations in silico before wet-lab testing starts [1][2]. That changes the pace of development quite a bit, especially when serum-free media space gets large fast.
| Feature | Model-Guided Optimisation | Experimental Trial-and-Error |
|---|---|---|
| Speed | High - in silico screening of thousands of formulations | Low - limited by cell doubling times and lab capacity |
| Data requirements | High - requires genome annotation and -omics data | Low - requires only basic growth and yield metrics |
| Fit for cultivated meat | Ideal for complex serum-free media and less-studied species | Better for initial screening or minor adjustments |
In practice, the model should narrow the design space before wet-lab validation. Model predictions can reduce the experimental space, and wet-lab data can then be used to refine and re-validate the model [1]. A simple workflow is often the best one: use in silico screening to shortlist conditions, test those in culture, then feed the results back into the model. Model, test, update, repeat.
IGF1 promotes proliferation of cultured meat in serum-free media
Applying pathway maps to cell lines, bioprocesses, and product characterisation
Once pathway maps and models are in place, the job shifts from description to bioprocess control. The same datasets can help teams pick better-performing lines, adjust feeds by culture stage, and set QC markers that catch drift before it shows up in yield or phenotype.
Cell line engineering and selection targets from pathway data
Pathway data turns cell line selection into a mechanistic exercise rather than a trial-and-error one. When comparing candidate lines, the most useful traits are lactate and ammonia output rates, amino acid consumption profiles, and how cleanly cells move from proliferation into differentiation. A line that completes that shift cleanly is a stronger production candidate than one that gets stuck partway through.
Passage number matters too. In an April 2024 study published in Food Research International, researchers at Seoul National University identified three spent-media biomarkers - γ-glutamyl-L-leucine, cytosine, and ketoleucine - that changed exclusively in pig muscle stem cells at passage 3, coinciding with significant loss of myogenic gene expression. Routine LC-MS of spent media can flag suboptimal batches early.
Bioreactor operation, scale-up and culture mode choices
The same readouts used to rank cell lines also help determine how to scale cell lines for bioreactor cultivation. As cells move from glycolysis towards oxidative phosphorylation during differentiation, feed strategy needs to shift with the culture stage [3]. Batch mode gives a clean baseline for identifying primary nutrient depletion rates. Fed-batch and perfusion make it possible to match feed input to metabolic state, which matters once lactate and ammonia start to build up.
| Format / Mode | Metabolic Control Perspective | Data Interpretation Challenge |
|---|---|---|
| 2D culture | High nutrient access; limited structural fidelity | Does not reflect 3D metabolic gradients |
| Microcarrier | High surface-to-volume ratio; gradient risks | Requires spent media analysis to monitor local depletion [1] |
| Scaffold | Mimics 3D architecture; complex diffusion dynamics | Difficult to extract intracellular metabolites; relies on GEM predictions [1] |
| Batch | Simple; nutrients deplete while lactate and ammonia accumulate | Baseline for identifying primary nutrient depletion rates |
| Fed-batch / Perfusion | Allows precise control of glucose/lactate flux | Requires real-time MFA to balance feed rates with consumption |
At scale, one vessel rarely behaves like one uniform environment. Nutrient gradients create different metabolic zones across the bioreactor. GEMs can model how flux shifts under different local conditions and point to where nutrient limitation is likely to show up before it appears in process data. That makes the model output directly useful for feed strategy, oxygen demand, and waste control.
Conclusion: a minimum pathway mapping stack for cultivated meat R&D
Together, these readouts form a minimum control stack for cultivated meat R&D.
Start with central pathway hypotheses: glycolysis, the TCA cycle, and amino acid consumption. Then build a spent media dataset with standard LC-MS. Add stable isotope tracing when you need to confirm whether a carbon source is entering the TCA cycle, or whether glutamine is being consumed oxidatively or reductively. After that, layer in a GEM, such as BtaSBML2986 for bovine cells [4], to narrow the media design space before wet-lab validation starts.
The point is to keep feeding results back into the model, update assumptions, and let each round of data sharpen the next set of choices. Mapping programmes that stay separate from cell line selection, feed strategy, and quality assessment can produce interesting datasets, but they do little for production.
FAQs
Why isn’t pool-size metabolomics enough?
Pool-size metabolomics measures steady-state metabolite concentrations. That means it gives you a static snapshot of the cell, not a readout of fluxes - the rates at which metabolic reactions are actually running.
For cultivated meat R&D, that limitation matters. A concentration map on its own won't tell you where the metabolic bottlenecks are, or how specific nutrients are supporting growth and differentiation. To answer those questions, you need dynamic methods such as metabolic flux analysis.
When should teams use 13C tracing?
Teams should use 13C-metabolic flux analysis (MFA) when they need to pinpoint and fix metabolic bottlenecks that hold back production efficiency and slow progress towards price parity in cultivated meat.
Systems biology and genome-scale metabolic models can help with media optimisation. But 13C-MFA is still a gap in the field for most relevant species, and so far it has only been used in a limited set of cell types.
How do pathway maps improve feed design?
Pathway maps built from genome-scale metabolic models help researchers pinpoint what cells need from the medium, where metabolism starts to slow down, and how energy is being spent during cultivated meat production.
When you pair these maps with flux balance analysis, they become much more useful. They can guide more targeted culture media design for stages such as proliferation and differentiation. That helps teams improve biomass accumulation, run production more efficiently, and steer final nutritional and sensory quality with more control.


