

Cleanrooms demand strict monitoring to maintain cleanliness, especially in cultivated meat production, where contamination risks can compromise entire batches. This is where alert and action limits come into play, acting as early warning indicators. Here's what you need to know:
- Alert limits signal deviations that need closer monitoring.
- Action limits confirm contamination, requiring immediate corrective action.
- Limits are often set statistically, using methods like mean +2 or +3 standard deviations, or percentiles (95th for alert, 99th for action).
- Regulatory standards like ISO 14644, EU GMP Annex 1, and USP <1116> provide guidance on thresholds and monitoring practices.
- Effective management includes risk assessments, regular reviews, and proper response protocols for breaches.
GMP Environmental Monitoring for Pharmaceutical Clean Rooms 2024
Regulatory Standards for Alert and Action Limits
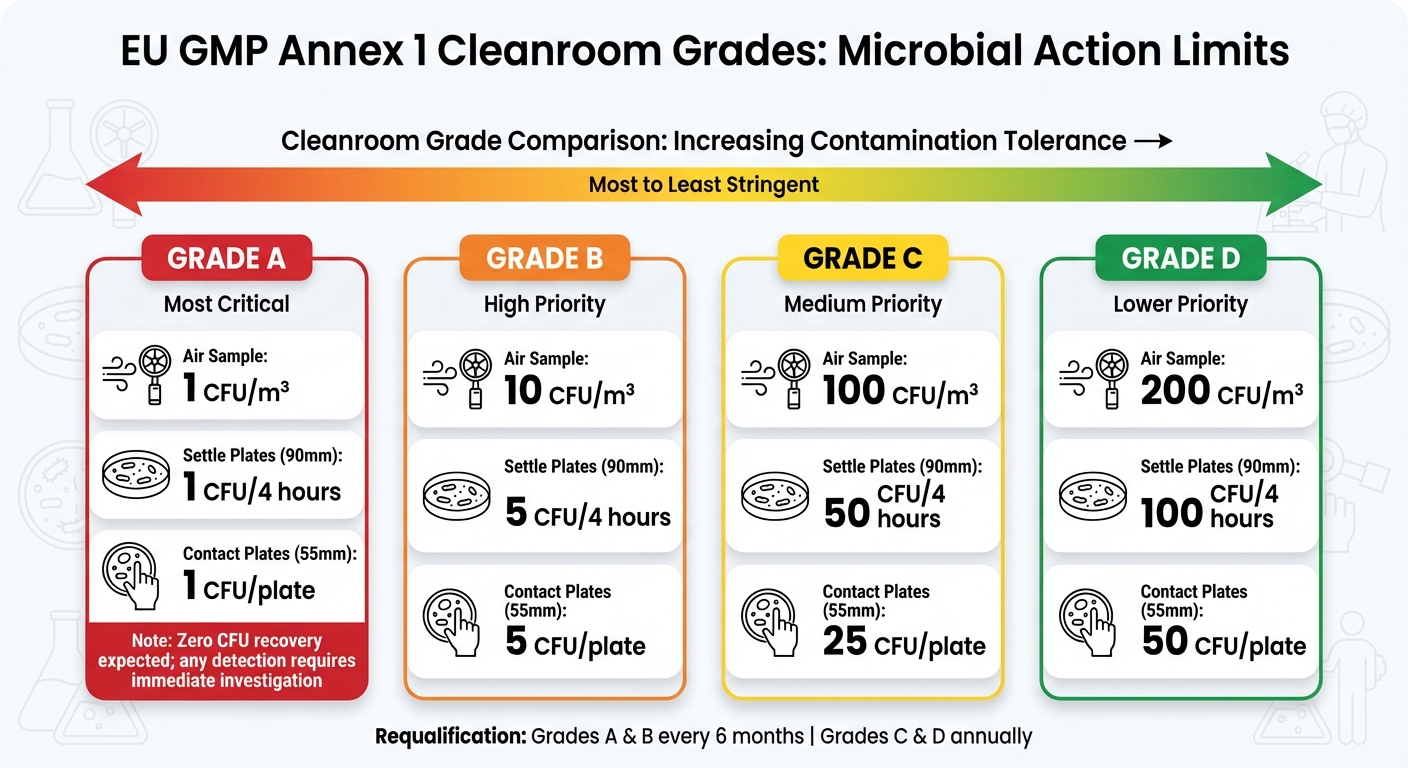
EU GMP Annex 1 Cleanroom Grades: Microbial Limits Comparison
Three key regulatory frameworks provide guidance on environmental monitoring limits in cleanrooms, each offering distinct but complementary insights.
ISO 14644-1 and Cleanroom Classifications
ISO 14644-1 is the internationally recognised standard for assessing airborne particulate cleanliness. It defines nine cleanroom classes (ISO Class 1 through 9), with specific particle concentration limits for each. For cultivated meat production, ISO Classes 5 to 8 are particularly relevant, as they set the required cleanliness thresholds.
In ISO Class 5 environments - comparable to Grade A in pharmaceutical terms - the particle limit is 3,520 particles (≥0.5 µm) per cubic metre. This level of cleanliness is about 100,000 times cleaner than typical room air[9]. By comparison, ISO Class 7 allows 352,000 particles per cubic metre, and ISO Class 8 permits up to 3,520,000 particles per cubic metre[8].
It's important to note the distinction between "at-rest" and "in-operation" states. During operation, cleanrooms often shift to one classification level higher due to the added influence of personnel and equipment[9].
This standard provides the baseline for understanding the microbiological thresholds detailed in EU GMP Annex 1.
EU GMP Annex 1 Requirements
EU GMP Annex 1 expands on ISO 14644-1 by setting specific microbiological limits and emphasising continuous monitoring and risk-based approaches.
The guidance defines four cleanroom grades (A through D) with strict microbial action levels:
| Grade | Air Sample (CFU/m³) | Settle Plates (90 mm) (CFU/4 hours) | Contact Plates (55 mm) (CFU/plate) |
|---|---|---|---|
| A | 1 | 1 | 1 |
| B | 10 | 5 | 5 |
| C | 100 | 50 | 25 |
| D | 200 | 100 | 50 |
Grade A environments are expected to have zero CFU recovery, with any detection requiring immediate investigation[7]. This level of stringency reflects the critical need for sterility in aseptic zones.
Annex 1 also specifies requalification intervals: every six months for Grades A and B (ISO 5 and 6) and annually for Grades C and D.
A notable case occurred in June 2024 when the FDA issued a warning letter to Optikem International Inc. following inspections of its Denver facility. Between February 2021 and March 2023, repeated fungal and bacterial recoveries were noted in ISO 5 critical areas. The company failed to adequately address root causes, even though these areas are expected to remain essentially contamination-free. This led to a second warning letter in August 2024 and the facility being placed on import alert status[9].
USP <1116>: Microbial Monitoring
USP <1116> offers a different perspective, focusing on trend analysis and risk-based monitoring rather than rigid pass/fail criteria.
The guidance explicitly states:
The numerical values for air, surface, and personnel monitoring included in this chapter are not intended to represent limits or specifications but are strictly informational[8].
One of the key metrics introduced by USP <1116> is the Contamination Recovery Rate (CRR), which tracks contamination frequency. This approach is particularly useful in ISO Class 5 environments, where contamination recoveries are rare[8].
USP <1116> also acknowledges the inherent challenges of achieving zero contamination when human operators are present. For instance, surface monitoring methods typically recover less than 50% of microorganisms, even under controlled conditions with high microbial loads[8]. This realistic viewpoint encourages facilities to set data-driven limits based on their own historical performance rather than relying on arbitrary averages.
The guidance underscores the importance of a robust microbiological monitoring programme to ensure consistently high-quality conditions. This approach is critical for establishing precise alert and action limits, particularly in the context of cultivated meat production[8].
How to Establish Alert and Action Limits
This section dives into the steps needed to set effective alert and action limits for cultivated meat facilities. These limits should be grounded in baseline data, solid statistical methods, and thorough risk assessments. The goal is to create thresholds that genuinely indicate control status rather than arbitrary numbers.
Collecting Environmental Monitoring Data
The first step is to create a detailed SOP covering sampling points, frequency, timing, sample size, and techniques[6]. For cultivated meat cleanrooms, this usually involves active air sampling, settle plates, surface swabs, and personnel monitoring during various operational states.
Initial performance qualification (PQ) data - typically from the first three batches - can be used to set temporary limits. However, these should later be refined using at least 40 data points gathered over a year[3]. During the first quarter, more frequent testing (weekly or monthly) helps establish a reliable baseline.
Monitoring both "at rest" and "in operation" states is critical. This approach evaluates the effectiveness of cleaning procedures and the impact of personnel and equipment on the environment[5][2]. One challenge is dealing with "spreader" colonies - microbial growth that covers the entire plate, making enumeration impossible. These cases should be excluded from historical data as they often indicate issues with test methods rather than actual environmental conditions[3].
Using Statistical Methods to Define Limits
Once data collection is complete, statistical techniques can help establish precise limits. Cleanroom microbiological data often includes many zero results, leading to a "zero-inflated" distribution, which complicates standard deviation-based methods[1][3]. The choice of statistical method depends on the data's distribution.
For non-normally distributed data, the percentile cut-off method is preferred. This approach is resistant to outliers and works well in high-cleanliness areas where zero counts dominate. Typically, the 95th percentile is used for alert limits, while the 99th percentile defines action limits[1][6].
For normally distributed data, limits are calculated using standard deviations from the mean. The alert level is set at Mean + 2 Standard Deviations (95% probability), and the action level at Mean + 3 Standard Deviations (99.7% probability)[1][2]. Before applying this method, test the data for normality. If the data is slightly skewed, transformations like the square root method can help normalise it[1].
| Distribution Type | Alert Level Method | Action Level Method |
|---|---|---|
| Normal Distribution | Mean + 2 Standard Deviations | Mean + 3 Standard Deviations |
| Non-Normal / Poisson | 95th Percentile | 99th Percentile |
Outliers should be handled carefully. In one study of 47 bioburden data sets, 70% were found to be statistically abnormal due to a single outlier (defined as a value greater than Mean + 2 Standard Deviations)[3]. Grubbs' Test can help identify these outliers, but they should only be removed with written justification of a "special cause", such as improper incubation, dropped plates, or sampling errors[1].
Incorporating Risk Assessments
Statistics alone don’t provide the full picture. Risk assessments ensure that limits align with the actual conditions and risks in the facility. This approach helps translate mathematical outputs into practical cleanroom management[1][3].
Setting overly strict thresholds, like 1 CFU in Grade C/D areas, can lead to unnecessary investigations[1]. Such low limits often reflect sampling errors rather than genuine issues and may cause investigation fatigue. Risk assessments can determine whether a spike is worth a full root cause analysis or is just an expected outlier[3][6].
In facilities using overkill sterilisation methods (e.g., ethylene oxide), risk assessments allow for more flexible limits. For instance, action levels might be set at 10 times the bioburden estimate, accounting for the safety margins built into these processes[3]. Conversely, methods like radiation sterilisation need stricter limits since bioburden directly impacts sterilisation effectiveness[3].
Risk assessments also consider aseptic workflows and specific facility conditions. In high-cleanliness areas (Grade A/B), where zero counts are common, tracking contamination recovery rates - the percentage of samples showing any growth - can be more insightful than raw CFU counts[6]. Martell Winters, Senior Scientist at Nelson Laboratories, sums it up well:
Setting levels is not purely a mathematical exercise. It also involves looking at the proposed levels with common sense.[3]
sbb-itb-ffee270
Validating and Adjusting Limits Over Time
Setting initial thresholds is just the beginning - they need regular validation and updates as operational conditions evolve. Changes in seasons, equipment wear and tear, staffing, or process tweaks can all impact cleanroom environments. Limits that worked during Performance Qualification might no longer fit your current operations. By reviewing thresholds regularly, you can ensure they remain practical and meaningful rather than outdated figures.
Using Control Charts for Data Trending
Shewhart control charts are a powerful tool for distinguishing routine variations from significant contamination trends[6]. By visualising environmental data over time, these charts make it easier to identify patterns that raw numbers might obscure. In cultivated meat facilities, where maintaining sterility is non-negotiable, control charts can highlight whether you're facing random fluctuations or a more systematic drift towards losing control.
Trending isn't just about counting how often limits are breached. It’s about spotting patterns, like three consecutive results above the mean, which can signal emerging issues[5]. These patterns often point to problems before they turn into full-blown excursions. For example, if breaches consistently occur after preventative maintenance, that's a trend worth investigating - even if the results don’t yet exceed action limits.
In high-cleanliness areas like Grade A and B, where most samples show zero growth, raw colony-forming unit (CFU) counts may not offer much insight. Instead, focus on contamination recovery rates - the percentage of samples with any growth[6][5]. This approach paints a clearer picture of your control status when zero counts dominate the data. As Dr. Tim Sandle explains:
Alert and action levels are not specifications - they are 'snap-shot' indicators of potential adverse or upward trends, or out-of-control situations.[1]
Advanced monitoring tools, such as those using light-induced fluorescence, can generate thousands of data points daily from each location[6]. While this wealth of information provides deeper insights, it requires robust statistical tools and automation to filter out noise and highlight meaningful trends.
These insights then feed into regular reviews, helping refine your limits further.
Periodic Reviews and Adjustments
Statistical trending lays the groundwork for periodic reviews, ensuring your limits stay aligned with current conditions. Conduct these reviews annually or whenever you’ve gathered enough new data to redefine your baseline[1][2]. During these reviews, assess whether your limits still match your facility’s operational state or need adjustment due to changes like process upgrades or seasonal shifts.
Re-evaluate your data distribution to choose the right statistical method. For normally distributed data, stick with the standard deviation model (Mean + 2SD for alert, Mean + 3SD for action). For skewed data, opt for percentile cut-offs (95th percentile for alert, 99th percentile for action)[1][2].
Compare your limits against regulatory maximums from EU GMP Annex 1 or USP <1116>. No matter what your statistics suggest, action limits must never exceed these regulatory caps[1][5]. If major facility changes - like new HVAC systems or equipment - shift your baseline permanently, adjust your limits accordingly and document the reasoning[5].
Be careful not to set limits so low that they lead to constant, unnecessary alerts. For instance, an alert level of 1 CFU in a Grade C area might not provide useful investigative value and could result in "alert fatigue"[1]. Professional judgement is just as important as statistical accuracy. Any proposed changes should always go through a formal management review before being implemented[5].
Responding to Limit Excursions
Once statistical limits are in place and actively monitored, it’s crucial to respond effectively to any breaches. If a limit is exceeded, the first step is to determine whether it’s a sampling error or an actual issue with cleanroom control. While a single breach doesn’t automatically mean a loss of control, it still requires careful attention. As Cleanroom Technology explains:
A single viable sample with no growth does not guarantee control, and conversely, a single excursion does not indicate loss of control.[5]
The type of limit breached dictates the level of response. Alert limits suggest a potential shift in the process, while action limits demand an immediate and thorough investigation. Industry data shows that contamination batch failure rates average 11.2%, increasing to 19.5% when excluding R&D-scale operations. This highlights the importance of having a clear, structured response protocol in place[11].
Root Cause Analysis and Corrective Actions
Investigating breaches involves four key phases: Data Review and Trend Analysis, Root Cause Analysis, Corrective and Preventive Actions (CAPA), and Effectiveness Verification[12]. Start by identifying the microorganism to the genus level, which helps pinpoint the source - whether it’s soil, water, or human-related - and assess the effectiveness of your sanitisation processes[10].
To dig deeper into the cause, tools like Fishbone diagrams and "5-Why" analysis can help categorise issues into four main areas: personnel, equipment, environment, and process[12]. For example:
- Personnel: Check gowning compliance, aseptic techniques, and recent training records.
- Equipment: Inspect bioreactor seals, isolator gloves, transfer ports, and stainless steel surfaces for potential contamination traps like scratches.
- Environment: Evaluate HVAC systems, HEPA filters, and any fluctuations in temperature, pressure, or humidity.
- Process: Review cleaning procedures, including disinfectant dilution, contact time, and mopping frequency.
Elaine Kopis Sartain, Director of Technical Services at Steris Corp, stresses the importance of proactive measures:
The best way to prevent microbial problems from occurring is with proper facility design and well-developed training programmes which address personal accountability as well as technical training.[10]
Additional tools can enhance your investigation. For instance, ATP (adenosine triphosphate) surface testing can identify cleaning gaps, particularly in hard-to-reach areas around equipment bases[12]. Similarly, airflow visualisation using "smoke studies" during operations can reveal turbulence that might allow particles to circulate in critical zones[12]. For personnel, the "Read It, See It, Do It" training method - where operators study the SOP, observe a peer, and then perform tasks under supervision - can improve compliance and consistency[10].
Once the root cause is identified, document findings and implement corrective actions to restore cleanroom control.
Documentation and Revalidation
Action limit breaches require immediate investigation to identify root causes, assess the impact on previously produced batches, and implement CAPA measures[5]. This process includes preparing a formal deviation report, conducting root cause analysis, and drafting an impact statement[12].
After significant breaches, steps like intensive cleaning, retraining personnel, and follow-up monitoring help ensure the environment is back to its validated state[5][4]. It’s also essential to evaluate any batches produced during the breach to confirm product quality wasn’t compromised. Since the most common contamination risks stem from improper equipment sterilisation or exposure during the cell harvest stage, these batch assessments are non-negotiable[11].
Regular environmental monitoring trend reports help track excursion and recovery rates, ensuring the facility remains under control[5]. Periodic reviews of alert and action limits - typically conducted annually or after gathering sufficient historical data - ensure they remain suitable for the current processes and technology[5][2]. A written justification should accompany the statistical approach used to establish these limits[2].
Excursion Response Workflow
How you respond depends on whether the breach involves an alert limit or an action limit. Alert limits call for follow-up to identify potential trends, while action limits demand a more immediate and thorough investigation[5].
| Investigation Step | Action for Alert Limit | Action for Action Limit |
|---|---|---|
| Immediate Response | Assess if part of a trend; no immediate stoppage | Immediate investigation to determine impact and root cause |
| Data Review | Analyse historical trends and recovery rates | Full review of environmental monitoring (EM), HVAC, and process data for the specific batch |
| Microbial ID | Not usually required unless breaches persist | Mandatory identification to genus level |
| Remediation | Monitor subsequent samples to confirm normal parameters | Implement CAPA measures, such as intensive cleaning or retraining |
| Documentation | Record findings for management review | Prepare a formal deviation report with root cause analysis and impact assessment |
While it’s important not to overreact to individual alert events, they should still be used to monitor for trends or recurring issues, such as excursions following equipment maintenance[5][4]. For example, synchronising material transfers through pass-boxes with air pressure stabilisation times can help maintain the pressure cascade between Grade B and Grade A zones[12]. After corrective actions are implemented, follow-up sampling verifies that the cleanroom has returned to its expected operating parameters[5].
For more resources and guidance on cleanroom monitoring and control in cultivated meat production, visit Cellbase.
Best Practices for Setting and Managing Limits
Setting effective alert and action limits requires a methodical, data-driven approach tailored to your facility's actual performance. Start by gathering enough historical data - ideally from at least three batches for new facilities - and consider adopting long-term limits after a year of operation [3]. Because cleanroom microbial data often includes many zero results, it's recommended to use the 95th percentile for alert levels and the 99th percentile for action levels [1][5].
Dr Tim Sandle highlights that these thresholds are meant to signal potential trends rather than act as fixed specifications [1]. Before finalising limits, use statistical tools to identify outliers. Any outliers should only be excluded with proper documentation, such as when issues like a dropped plate or incorrect incubation are confirmed [1][3]. Importantly, facility-specific limits must always comply with the regulatory maximums set by EU GMP Annex 1 and ISO standards [1][5].
Once limits are established, ongoing management is key. This involves continuous trend analysis, not just tracking breaches. Pay attention to metrics like "contamination rates" (non-zero results frequency) and "critical recovery rates" to spot early signs of control loss before they escalate into action limit breaches [5]. Regular reviews - usually conducted annually - are essential for adjusting limits to reflect changes in processes, new equipment, or shifts in the microbial environment of your facility [3][5]. For cultivated meat production, where cell cultures are especially prone to microbial competition, these practices are critical to avoiding batch losses and meeting compliance requirements.
Modern data analysis tools can simplify this process by automating trend detection and providing real-time alerts, reducing the risk of missing isolated breaches during manual reviews [5]. For further guidance on cleanroom monitoring in cultivated meat facilities, visit Cellbase.
FAQs
What is the difference between alert and action limits in cleanroom monitoring?
Alert limits serve as early warning signs, highlighting a possible shift from the usual conditions within a cleanroom. When these limits are crossed, it’s a signal to monitor the situation more closely or investigate further to avoid potential problems.
Action limits, however, are stricter benchmarks. Breaching these limits demands immediate corrective action to tackle the issue and uphold cleanroom standards. These thresholds are essential for preserving product quality and maintaining a controlled environment.
How are cleanroom alert and action limits determined using statistical methods?
Cleanroom alert and action limits are determined through a statistical review of historical environmental monitoring data. Typically, the 97.5th percentile is used to set alert limits, while the 99.85th percentile is applied for action limits. These figures correspond to specific standard deviations above the mean, helping to pinpoint unusual variations that might need attention or corrective measures.
By studying trends and fluctuations in the data, these thresholds support a forward-thinking strategy to uphold cleanroom standards. This approach not only reduces the risk of contamination but also ensures adherence to regulatory requirements.
Why is it important to regularly review and adjust cleanroom alert and action limits?
Regular checks and updates to alert and action limits in cleanrooms are crucial for maintaining consistent environmental control and keeping up with changing standards. By doing so, deviations from normal conditions can be spotted early, enabling swift corrective actions to uphold cleanliness and safety.
In the cultivated meat industry, where precision is non-negotiable, adjusting these limits to align with new processes or regulatory changes is key to ensuring top-tier quality. This forward-thinking approach reduces risks, ensures compliance, and helps maintain high operational standards in cleanroom settings.


