

If I had to cut this article to one point, it would be this: at bioreactor scale, single-point monitoring stops being enough. Once you move past small bench vessels, mixing slows, gradients form, probe lag matters more, and drift can put a full run at risk. In some set-ups, integrated PAT has pushed deviation rates below 2% and cut batch disposition time by up to 30%.
If you work in cultivated meat R&D, bioprocess engineering, or scale-up, I’d focus on four things first:
- Core control sensors: temperature, pH, DO, dissolved CO2, pressure, foam, level, and flow
- Process-state tools: Raman and NIR spectroscopy for nutrients and metabolites
- Biomass tools: OD/turbidity, capacitance, off-gas, and online metabolite analysers
- Scale-up checks: probe placement, response lag, fouling, drift, port limits, and control-system fit
The article’s main message is simple: sensor choice is a control decision, not just an equipment decision. A set-up that works at ~3 L may fail at 15 L, 1,000 L, or above because the vessel no longer behaves as one mixed zone.
Sensors in bioreactors
Effective scale-up requires integrating advanced sensors and monitoring systems to maintain precise environmental control.
sbb-itb-ffee270
Quick Comparison
| Monitoring layer | Main job | Typical tools | What changes at scale |
|---|---|---|---|
| Core control | Hold culture conditions in range | Temperature, pH, DO, dCO2, pressure, foam, level, flow | Gradients, lag, and probe location matter more |
| Composition | Track nutrients and by-products | NIR, Raman | Model transfer and probe position become limiting factors |
| Biomass/viability | Track growth and live cells | OD, turbidity, and capacitance | Fouling, microcarriers, and sampling delays matter more |
| Respiration/metabolism | Track demand and waste in real time | Off-gas, online metabolite analysers, soft sensors | Feed and gas control need tighter links to live data |
I’d read the rest of the piece as a guide to building a monitoring stack that matches cell biology, vessel size, and control logic - then checking that the bioreactor, ports, and software can actually support it.
What Changes When Monitoring Has to Scale With the Bioreactor
Bioreactor Monitoring Stack: Lab vs. Pilot/Production Scale
At around 3 L, mixing is usually fast enough that a single probe can stand in for the vessel as a whole. Once you move to 15 L or more, that starts to fall apart. Mixing takes longer, and you can get sharp gradients in dissolved oxygen, pH and nutrient concentration across the tank. So a probe in one spot may not match what cells are seeing somewhere else in the bioreactor [2].
Sensor lag also becomes a bigger deal at scale. If the control system adds pH buffer or ramps up sparging, the sensor does not report that change straight away. In a small vessel, that delay is often small enough to ignore. In a larger vessel, it can be long enough for the controller to push too far, leading to oscillations before the system settles. Cells feel that instability first [2]. As volume goes up, oxygen transfer, shear and response timing can all change the way the process behaves at scale.
One of the first bottlenecks to show up is often oxygen transfer. At larger working volumes, maintaining oxygen transfer gets harder, which increases the risk of oxygen limitation and reduced cell viability [3]. At the same time, live monitoring of metabolites such as glucose, lactate and ammonia matters more, because nutrient gradients and by-product build-up can appear faster in larger vessels [2]. In cultivated meat processes, that can affect growth, viability and final product quality.
Drift adds another layer of risk. Long runs - often several weeks at pilot and production scale - give in-situ sensors more time to move away from their calibrated baseline. At bench scale, a drifting probe may affect one small batch. At production scale, the same issue can put an entire run at risk [2].
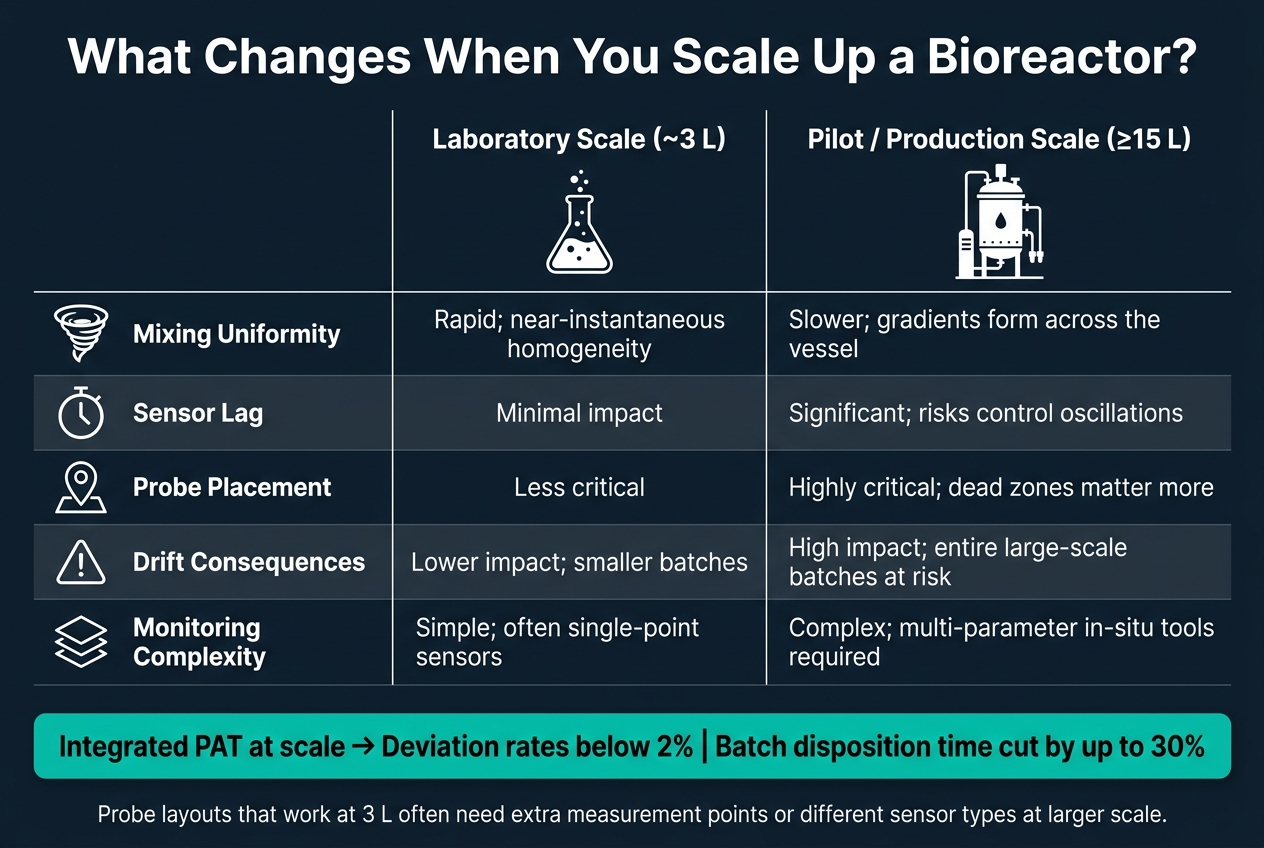
| Parameter | Laboratory scale (≈3 L) | Pilot/production scale (≥15 L) |
|---|---|---|
| Mixing uniformity | Rapid; near-instantaneous homogeneity | Slower; gradients form across the vessel |
| Sensor lag | Minimal | Significant; risks control oscillations |
| Probe placement | Less critical | Highly critical; dead zones matter more |
| Drift consequences | Lower impact; smaller batches | High impact; entire large-scale batches at risk |
| Monitoring complexity | Simple; often relies on single-point sensors | Complex; may require multi-parameter in-situ tools |
These scale effects shape which sensors matter most and where they need to sit. Monitoring plans need to be revalidated as volume increases; probe layouts that work at 3 L often need extra measurement points or different sensor types at larger scale [2][3].
1. Cellbase

Scale-up also needs a clear path to monitoring hardware that will work with the process and with the rest of the control setup. Cellbase is a specialised B2B marketplace focused only on the cultivated meat sector, helping teams find probes, analysers, and control equipment that fit their process. That makes it a practical place to start before picking the first in-line sensors.
Teams can browse categories tied directly to process monitoring, including electrochemical and optical sensors, PAT instruments such as near-infrared and Raman spectroscopy systems, and capacitance probes for live cell density measurement. Cellbase also helps teams check data-output compatibility across instruments, which matters when you're trying to integrate hardware from several suppliers into one control stack. That can help teams narrow down options for bench, pilot, and production scale.
With sourcing covered, the next step is selecting sensors that keep each key variable in range.
2. Temperature Probes
Temperature is a core critical process parameter in bioreactors. In cultivated meat, even small shifts can alter growth, metabolism, and product quality. As working volume goes up, one temperature reading can mask local gradients. At larger scale, the problem is not only measuring temperature. It is making sure temperature is even across the vessel.
Parameter Coverage
Temperature probes measure vessel temperature. For vessel measurement, use Pt100 or Pt1000 RTDs. They give the precision needed for bioprocess control. Keep thermocouples for ancillary equipment, where a broader operating range matters more than tight precision.
Inline or Automated Data Availability
Temperature probes send a continuous signal to bioprocess control software. That supports alarms, trend analysis, and automatic jacket or cooling changes. Temperature traces are also stored in electronic batch records, which helps with deviation work, model building, and process characterisation during scale-up.
Scale-Up Control Value
At scale, higher heat load and a lower surface-area-to-volume ratio make temperature gradients more likely. Multi-point measurement during engineering runs is a scale-up validation tool, not just an instrumentation decision. It can reveal hot or cool zones that a single probe will miss. Once temperature is under control, pH and dissolved oxygen usually become the next limits to hold.
Compatibility With Cultivated Meat Bioprocesses
Materials must withstand sterilisation and keep leachables low. In single-use vs reusable bioreactors, sensor strategy differs. In single-use systems, use pre-calibrated disposable sensors or bag-integrated sensors. In reusable systems, check calibration against a traceable reference at defined intervals. Probe fit and calibration should be locked down before moving to the next sensor type.
3. pH Probes
After temperature, pH is usually the next parameter to lock down. In cultivated meat bioprocessing, it is also one of the most tightly controlled variables. Most cultures run at pH 6.8–7.4, and even short drift can change cell growth and differentiation. Control bands are often only ±0.05–0.1 pH units. Move outside that window, and you can disrupt proliferation, shift differentiation paths, and change final product quality.
Parameter Coverage
Use electrochemical glass combination electrodes across the pH 6.0–8.0 range. For this application, you want ±0.01–0.02 pH unit accuracy, a 30–60 second response time, and built-in temperature compensation. In runs longer than ten days, probe drift can reach 0.1–0.2 pH units. That is why two-point calibration before each campaign is standard, with mid-run offline reference checks where practical.
Inline or Automated Data Availability
Continuous pH data should feed into SCADA/DCS so you can run closed-loop acid/base and CO₂ control. Add alarms, deadbands, and rate limits to avoid local pH spikes. But there is a catch: the control loop is only as good as the measurement. If the probe is not reading bulk broth conditions, the controller will act on the wrong signal.
Scale-Up Control Value
At production scale - 1,000 L and above - pH can shift by 0.3–0.4 units across the vessel. That makes probe placement and PID tuning a big deal. Keep probes away from spargers and feed inlets, where local pH can look nothing like the rest of the tank.
During early scale-up runs, it helps to compare inline readings with offline samples taken from multiple vessel locations. That gives you a map of pH gradients inside the bioreactor. From there, you can adjust probe position and tune the controller based on what the vessel is actually doing, not what you hoped it would do.
Compatibility With Cultivated Meat Bioprocesses
Probe selection matters just as much as the control strategy. Cultivated meat media can foul glass membranes and reference junctions over time. When that happens, drift goes up and probe life drops. So inspect, clean, and replace probes before they become a problem.
For single-use bioreactor systems, pre-calibrated optical pH patches can make life easier. These patches are gamma-sterilised and built into the bag wall, so there is no need for steam sterilisation or cleaning. The trade-off is accuracy: they are usually in the ±0.05–0.1 pH unit range, which is a bit lower than standard glass electrodes.
In perfusion or high-cell-density setups, retractable housings are worth considering because they let you exchange probes without breaking sterility. And in any food-grade operation, calibration records, maintenance logs, and offline verification data should be kept up to date. Cellbase helps match pH probe formats, connectors, and housing types to specific cultivated meat bioreactor systems.
4. Dissolved Oxygen Sensors
Once pH is under control, dissolved oxygen is often the next bottleneck. Oxygen does not dissolve well in culture media, and holding DO steady gets harder as bioreactor volume increases.
Parameter Coverage
In high-density perfusion runs, cell concentrations can reach 2.0 × 10^7 to 7.0 × 10^7 cells/mL when using high-performance primary muscle cells, and oxygen demand climbs fast[5]. At that point, the main scale-up metric is k_La. It is usually measured with the dynamic method: strip oxygen with nitrogen, then monitor recovery after aeration starts again[5].
Inline or Automated Data Availability
Inline DO sensors send continuous readings to automated production systems. That system can run a DO cascade to hold the setpoint, usually by increasing agitation first, then airflow, and then pure oxygen injection[4]. Those live readings are what make the cascade work. Probe response time also matters. If the sensor lags, the control loop lags with it. Modern optical sensors tend to handle this better than polarographic probes[5].
Scale-Up Control Value
This is why sensor stability matters just as much as oxygen transfer. In large bioreactors, low-oxygen zones can form away from the impeller. Real-time DO data shows when oxygen supply is no longer keeping up with cell demand, before you see drift in growth or metabolism[5].
Compatibility With Cultivated Meat Bioprocesses
For cultivated meat, this trade-off is hard to ignore. The cells are shear-sensitive, so you cannot just keep turning up agitation to push more oxygen in[4][5]. DO sensors give real-time feedback on the minimum mixing needed to stay within range.
Optical, fluorescence-based sensors are becoming the preferred option over polarographic probes because they offer better stability, faster response, and lower maintenance. By contrast, polarographic probes may need membrane replacement every four to eight weeks[4]. In media-rich systems, anti-fouling probe screens or scheduled cleaning cycles can also reduce biomass build-up on the probe surface and help keep readings dependable[4].
5. Dissolved CO2 Sensors
CO2 is a metabolic by-product, and it gets harder to strip out as bioreactors get larger. That means dCO₂ can start drifting before operators spot a problem through other process signals.
Parameter Coverage
These sensors measure dissolved CO2 concentration in the culture broth. When dCO₂ climbs, it can affect pH and increase cell stress, so this is not a reading you want to park on a dashboard and ignore. Whether using benchtop bioreactors for R&D or larger vessels, this data must feed straight into control logic. It needs to feed straight into control logic.
Two common sensor types are used here. Severinghaus-type electrochemical sensors infer dCO₂ from a pH shift across a CO2-permeable membrane. Optical or fluorescent sensors use CO2-sensitive dyes to generate the signal. Different hardware choices come with different maintenance and drift profiles, but the job is the same: track dissolved CO2 closely enough to support process control.
Inline or Automated Data Availability
Inline and in-situ set-ups allow continuous measurement without manual sampling, which is the whole point in a dynamic culture. In the control system, the dCO₂ signal should do more than log data. It should trigger alarms and adjust gassing or stripping when the process moves past set limits.
Put simply, dCO₂ is a direct input to gas-transfer control, not a standalone metric.
Scale-Up Control Value
As pilot-scale systems increase in volume, CO2 stripping gets less efficient. Longer diffusion paths, a lower surface-area-to-volume ratio, and shifts in mixing behaviour can all lead to dCO₂ gradients across the vessel. That's where real-time measurement starts to earn its place.
If you can see dCO₂ moving in real time, you can spot those gradients before they start hitting viability or batch consistency. In scale-up work, that early warning matters. A vessel can look fine on bulk pH or dissolved oxygen while local CO2 build-up is already putting cells under strain.
Compatibility With Cultivated Meat Bioprocesses
For cultivated meat, dCO₂ sensors need to keep calibration in nutrient-rich media, handle aseptic operation, and connect cleanly with the control platform. That control layer also ties into pressure, foam, and level signals, since all three can affect gas removal in the next step of the process.
6. Pressure, Foam and Level Sensors
After dissolved CO2, the next control layer is pressure, foam and level. These signals shape gas exchange, sterility and volume balance. In practice, pressure, foam and level sensors help hold back-pressure steady, stop foam carryover, and keep feed and harvest volumes where they should be.
Parameter Coverage
Pressure tracks back-pressure and gas balance. Liquid level tracks feed, harvest and perfusion volume. Foam sensing is tied straight to process stability. If foam builds up, it can disrupt gas exchange, block vents, and increase contamination risk if it reaches the headspace or exhaust filters.
Pressure control also affects stripping and sparging efficiency, so this sensor set links directly to the CO2 and dissolved oxygen control covered in the previous sections. Taken together, these signals support one control strategy for gas flow, foam suppression and volume balance. [6]
Inline or Automated Data Availability
These sensors are installed in-line or integrated into the bag, with continuous contact with the bioreactor contents. At larger working volumes, these variables can shift faster than an operator can correct by hand. Once tied into control software, they can trigger fast automated actions, such as changing gas flow rates, agitation speed or pump speeds in real time. [6]
Scale-Up Control Value
At scale, these signals help prevent overflow, cut foam-related contamination risk, and keep gas transfer and liquid handling within defined limits. [6]
Compatibility With Cultivated Meat Bioprocesses
Level data supports feed additions, harvest timing and perfusion balance, which makes it a direct input for fed-batch and perfusion control in cultivated meat processes. Pressure and foam signals matter just as much. Together, they close the loop on gas flow, foam control and volume balance, then feed into the full control stack where alarms and automated actions keep the vessel stable.
7. Flow Meters
After pressure, foam and level, the next thing to check is how fast media, gas and harvest streams are moving.
Flow meters measure liquid and gas flow rates through the bioreactor system. Pressure, foam and level tell you what is happening inside the vessel. Flow meters tell you how much is going in, how much is coming out, and how fast.
Parameter Coverage
Flow meters measure the rate of media, gas and harvest movement through the system. That sounds simple, but it matters a lot in practice. If feed flow drifts, perfusion balance shifts. If harvest flow changes, residence time and cell retention can shift with it.
Beyond straight flow measurement, flow splitters can route sample streams to online analysers. That supports real-time measurement of titre and key metabolites.[7]
Inline or Automated Data Availability
Automated autosamplers and flow splitters can link the bioreactor to online analysers without interrupting the culture. In other words, you can pull data without stopping the process or opening the system.
This matters most in continuous processes, where flow data needs to support closed-loop control. If the process is running for long periods, small errors in flow do not stay small for long.
Scale-Up Control Value
In cultivated meat scale-up, flow meters support feed rate control, perfusion balance and harvest timing across longer runs. That helps quality-by-design by keeping flow, sampling and feed rates within control limits.
Put simply, flow measurement sits between vessel state and process action. It links what the bioreactor is doing to the next layer of online analysis and control.
Compatibility With Cultivated Meat Bioprocesses
In cultivated meat scale-up, accurate flow measurement across media, perfusion and harvest streams helps keep longer runs stable. This is especially useful when several streams need to stay aligned over time, not just at one time point.
Flow splitting lets one stream feed multiple analysers at once, connecting vessel conditions straight to the control stack.[7]
8. Near-Infrared Spectroscopy
Where flow meters show movement, NIR shows liquid-phase composition.
NIR spectroscopy measures broth composition in real time without the need for manual sampling.
Parameter Coverage
NIR reads overtones, combination bands and scattering in the broth [8]. It does not measure concentration directly. Instead, it infers concentrations from multivariate calibration models trained against reference data. In practice, that means one NIR stream can track biomass, substrates and metabolites at the same time [8][9][10].
A big plus for long runs is model longevity. In one case, calibration models held accuracy for up to 274 days after calibration [9]. That matters in extended scale-up campaigns, where frequent model rebuilds can become a burden.
Inline or Automated Data Availability
NIR can be deployed in situ with sterilisable fibre-optic immersion probes, or ex situ through glass vessel walls or flow-through loops [8][10]. In situ probes give the most direct real-time readout, but they need to tolerate sterilisation-in-place (SIP). Ex situ set-ups on glass walls are simpler to maintain, though they can skew the read if liquid near the wall does not reflect the bulk broth [8].
For fibre-optic probes, it is best to focus signal acquisition on the first and second overtone regions. Fibre cables can add noise above 2,100 nm in the combination region [8].
Scale-Up Control Value
As vessel volume increases, NIR gives a continuous view of process trajectory, which supports automatic control and process optimisation [8][9]. That said, probe placement matters. In large vessels, mixing gradients and centrifugal forces can skew biomass readings if the probe sits too close to the wall. As bioreactor size grows, probe position should be checked against the Theory of Sampling (TOS) [8].
That makes NIR a useful link between process control and molecular-specific spectroscopy.
Compatibility With Cultivated Meat Bioprocesses
NIR fits well with the mammalian cell cultures used in cultivated meat production. It can track nutrient uptake and by-product build-up at the same time. Glutamine is a key substrate, and ammonia is a common inhibitory by-product, so following both in real time is helpful [2][10].
Biomass tracking across 1–60 g/L has been shown [8], which covers density ranges that matter for cultivated meat scale-up.
NIR also pairs well with off-gas analysis and Raman spectroscopy. Off-gas data helps frame metabolic state, while Raman adds higher chemical specificity. Raman spectroscopy covers the next layer of chemical detail.
9. Raman Spectroscopy
Where NIR shows broad process movement, Raman gives you tighter chemical detail.
Parameter Coverage
Raman offers better chemical specificity than NIR and can track glucose, glutamine, lactate, ammonia, glutamate, total cell density and viable cell density in a single in-line readout [2]. It can also monitor process quality attributes such as glycosylation and titre [11].
Typical limits of detection are 0.20–0.46 g/L for glucose and lactate [11]. In complex media, fluorescence can get in the way. This is particularly relevant when using specialized basal media formulations. In those cases, time-gated Raman helps reduce fluorescence interference from the media [11].
Inline or Automated Data Availability
Raman is used in situ through immersion probes placed directly in the bioreactor medium. Spectral output is then linked to analyte concentration using PLS models [2].
Scale-Up Control Value
One of Raman’s main strengths during scale-up is model transfer. Researchers at University College Dublin built PLS models in 3 L bioreactors and then transferred them to a 15 L pilot-scale bioreactor for real-time monitoring of glucose, glutamine, lactate, ammonia, glutamate and total cell density [2]. Six of seven analyte models transferred, while VCD showed variable transferability between scales [2].
That matters in practice. You can build models at benchtop scale, then check them at pilot scale while scaling cell lines for bioreactor cultivation before putting them into a control strategy. If the transfer holds, Raman gives you an early warning before glucose depletion or lactate and ammonia build-up start dragging down batch performance. For that reason, it fits nutrient control well. Biomass and suspension-state monitoring can then sit on top as a second layer.
Compatibility With Cultivated Meat Bioprocesses
Raman tracks both substrate depletion and by-product build-up, which helps flag metabolic stress early [11][2]. That profile maps well to cultivated meat cell culture, where feed status and waste accumulation can shift cell behaviour fast. For a fuller view of the culture, pair Raman with optical density and turbidity probes.
10. Optical Density and Turbidity Probes
After Raman gives you chemical composition, OD and turbidity add the biomass view to the monitoring stack.
Parameter Coverage
Both probe types measure how light behaves in a cell suspension. OD probes track light attenuation - in plain terms, how much light makes it through the culture - and convert that into a signal that lines up with offline spectrophotometry. Turbidity probes measure scattered light at a set angle, which helps track suspended particle load and broth clarity.[12]
They are both optical proxy measurements, so the signal includes everything that affects light: viable cells, dead cells, microcarriers and debris.[13] That makes them useful for following biomass trends, spotting shifts in growth rate, flagging the start of aggregation, and picking up contamination events. It also means they are less useful when you need to separate viability from total cell count. If viability matters, pair them with capacitance probes or offline checks.
| Aspect | OD Probes | Turbidity Probes |
|---|---|---|
| Primary signal | Light attenuation/absorbance-style proxy | Light scattering from suspended particles |
| Best use | Growth trend tracking and biomass monitoring | Clarity and particle-load monitoring |
| Main limitation | Interpretation varies with culture conditions | Affected by bubbles, debris and aggregates |
Inline or Automated Data Availability
These probes connect straight into the bioreactor control system through analogue (4–20 mA) or digital protocols such as Modbus or Profibus, with data arriving every few seconds to minutes.[12] That live stream can go into SCADA systems or manufacturing execution platforms, so operators can set alarms for growth drift instead of waiting on manual samples.
There is also a practical upside that tends to matter more than people expect: automated logging makes it much easier to compare growth curves across bench, pilot and production scale without manual transcription. When you're building scale-up datasets, that saves time and cuts avoidable handling errors.[12]
Scale-Up Control Value
At scale, biomass is not just something you observe. It becomes a live control variable.
Feed rates for glucose, amino acids or growth factors can be adjusted in real time based on the current growth phase. Harvest timing, medium exchange or differentiation switches can also be triggered once OD or turbidity reaches a set threshold.[12]
Just as useful is what the signal shows when the process starts drifting. If OD climbs more slowly than expected at pilot scale, even though seeding density and media match bench conditions, that gap can point to mixing limits, nutrient gradients or oxygen transfer constraints. Those are not small issues, and they often take much longer to spot through periodic sampling alone.[12] This early warning role is a big part of why these probes stay in the scale-up stack.
Compatibility With Cultivated Meat Bioprocesses
For cultivated meat, OD and turbidity probes fit well with suspension and microcarrier-based cultures, but they need careful calibration for each process setup. In microcarrier systems, the signal reflects both cells and carriers, so calibration curves need to account for microcarrier load and optical properties.[12] Placement matters as well. Sensors should be installed in well-mixed zones and kept away from impellers and spargers, where bubbles can add noise to the signal.[12]
Chemically defined and serum-free media often help by giving a cleaner signal background. Even so, some supplements, colour indicators or growth factors can still shift the baseline, so calibration against offline cell counts or DNA content is needed for each cell line and medium combination.[12] For teams sourcing probes for these process formats, Cellbase can help identify specialised sensor suppliers.[12]
For viability and live-cell tracking, the next layer is capacitance.
11. Capacitance and Dielectric Spectroscopy Probes
If OD and turbidity tell you total biomass, capacitance tells you how much of that biomass is still alive.
Parameter Coverage
Capacitance probes detect viable cells by measuring how intact membranes polarise in an alternating electric field. Cells with intact plasma membranes store charge and increase the medium's permittivity. Dead or damaged cells cannot do that, so they do not add to the signal. In practice, the output gives a direct, real-time read of Viable Cell Volume (VCV) or Viable Cell Density (VCD). That's why capacitance sits alongside optical methods instead of replacing them.
Multi-frequency scanning across roughly 0.1–20 MHz helps separate shifts in media conductivity from the cell signal. That matters during concentrated nutrient bolus feeds or after pH adjustment, when the broth chemistry can change fast. The same scan can also generate Cole-Cole parameters, which can give extra detail on cell size and membrane condition during differentiation.
Inline or Automated Data Availability
Capacitance probes connect straight into bioreactor control systems and provide a continuous signal. That makes them a good fit for automated feed control based on the culture's actual growth phase, not just a preset timetable.
They're also useful for spotting transitions between lag, exponential, and stationary phases. If you're trying to hit a differentiation switch or harvest window at the right moment, that timing matters.
Scale-Up Control Value
At pilot or production scale, offline viability sampling is slow and leaves gaps in the picture. Capacitance fills those gaps.
This is especially useful in perfusion. Perfusion campaigns run for long periods, and every manual sample adds contamination risk when a port is opened. A continuously running capacitance probe removes that repeated exposure while still showing live biomass in real time.
One catch: in long-duration runs, biofouling can become a problem. Proteins and cell debris can build up on the electrode surface and cause signal drift. Single-use capacitance sensors, now sold pre-integrated into bioreactor bags, help deal with this by removing the cleaning and sterilisation step between batches and cutting fouling-related drift.
Compatibility With Cultivated Meat Bioprocesses
Capacitance usually handles microcarrier cultures better than optical methods because it reads viable membranes rather than scattered light. Even so, at high microcarrier concentrations, the carriers can interfere physically with the electric field. So you still need calibration matched to the microcarrier type and loading.
For aggregates and spheroids, dielectric spectroscopy gives a more direct read of total viable volume than optical probes.
When bringing up a new cell line - for example, bovine or porcine myocytes - the usual practice is to baseline the probe in cell-free media first. The reason is simple: the ionic strength of cultivated meat media can shift the starting dielectric signal quite a bit. It also helps to compare early capacitance data with offline metabolic readouts such as glucose and lactate. That cross-check shows whether the VCV signal tracks the actual growth phase before the team starts using it for automated control.
That live viability signal also pairs well with off-gas analysis, which shows whether biomass growth is also showing up in metabolism.
12. Off-Gas and Online Metabolite Analysers
After biomass and viability, off-gas and metabolite analysers tell you something more direct: is the culture still supporting that growth, or is it starting to drift? Taken together, these tools show how respiration, nutrient drawdown and waste build-up change in real time.
Parameter Coverage
Off-gas analysers measure the carbon dioxide evolution rate (CER) and oxygen uptake rate (OUR) from the exhaust stream, most often with mass spectrometry [14]. Online metabolite analysers track key nutrients such as glucose and glutamine, along with waste species including lactate, ammonia and glutamate. In practice, glucose, glutamine, lactate and ammonia are the main real-time markers for feed status and waste accumulation.
These readings become far more useful when they sit in the same control layer as temperature, pH and dissolved oxygen. Off-gas data shows respiratory demand. Online metabolite data shows whether the nutrient and waste balance is still in range.
Inline or Automated Data Availability
Modern enzymatic probes now support continuous inline metabolite tracking [6]. Off-gas monitoring is continuous by design because it samples the exhaust stream, which makes it a practical source of real-time respiration data [14].
Scale-Up Control Value
Real-time gas and metabolite data can support closed-loop control of airflow, agitation and feed rate as culture demand changes [6]. That matters at scale. A drop in glucose, a rise in lactate, or a change in respiratory activity can develop fast, and these signals give operators a chance to respond before the process moves too far off target.
"Processing errors can be detected as they happen, and mitigated before they have the opportunity to become catastrophic." - Christopher Kistler, Fellow Scientist, Catalent Biologics [6]
Model-based soft sensors can also estimate biomass where direct measurement is hard, including in fixed-bed bioreactors [6].
Compatibility With Cultivated Meat Bioprocesses
For adherent cell cultures in cultivated meat production, fixed-bed bioreactors can gain from inline glucose and lactate monitoring, especially when the goal is to hold a stable nutrient environment during perfusion [6]. Sensor choice also matters when evaluating single-use vs reusable systems. Teams need to confirm that sensors remain accurate after sterilisation, including gamma irradiation or X-ray sterilisation [6].
Bag-integrated sensors cut handling steps and help protect sterility. Used together, off-gas and metabolite signals turn vessel state into something operators can act on, not just watch.
How the Tools Work Together Across a Full Monitoring Stack
No single sensor can tell you everything that is happening inside a bioreactor. Temperature, pH, dissolved oxygen, pressure and flow are the backbone of process control, but they only show part of the picture. They help hold the process steady. They do not, on their own, describe the full state of the biology or the critical quality attributes.
The stack works because each layer fills in gaps left by the others. At scale, that point becomes hard to ignore: these tools do not work best as stand-alone devices. They work as a system.
A useful way to frame the stack is in four layers. Core inline control sensors cover temperature, pH, dissolved oxygen, pressure and flow. These give you the baseline environmental readout needed to keep the process stable. Optical and spectroscopic tools, including Raman and near-infrared spectroscopy, add real-time molecular fingerprinting for nutrients and metabolites. Viable biomass and metabolite monitoring brings in capacitance probes, off-gas analysers and soft sensors to track viable cell density and metabolite trends. The last layer is software integration: SCADA systems, digital twins and AI/ML models bring those signals together into one control framework.
This matters most when the signals are interpreted through control models that reflect scale-driven gradients. In a production bioreactor, mixing is slower and gradients develop across the vessel. A single-point sensor can miss those local differences. That is where digital twins and CFD become useful. They help predict spatial variation and tighten control logic before engineering runs start.
So tool choice is not just about picking sensors one by one. It is a system design decision tied to scale, mixing behaviour and what the process is likely to hide from you.
Comparison Tables for Choosing the Right Monitoring Mix
Choosing sensors is a control decision that impacts your equipment cost projections. The best mix depends on the decisions those sensors let you make: closed-loop control, process insight, or both.
The first table covers the control backbone. The second looks at tools that add process insight.
Classical Sensors: Control Backbone
These sensors run continuously and feed straight into closed-loop control. Dissolved CO2 becomes a more important signal as gas stripping gets harder at larger scale.
| Sensor | Parameter Measured | Response Time | Scale-Up Role |
|---|---|---|---|
| Temperature | Broth temperature | Fast | Maintain stable culture conditions |
| pH | Acidity/alkalinity | Fast | Manage gradients from base addition and lactate accumulation |
| Dissolved Oxygen (DO) | Oxygen tension | Fast | Balance oxygen transfer and uptake; manage gradients |
| Dissolved CO2 | CO2 partial pressure | Moderate | Monitor stripping efficiency; priority increases at larger volumes |
| Pressure | Vessel pressure | Fast | Safety management and gas solubility control |
| Foam/Level | Liquid height and foam build-up | Fast | Prevent exhaust filter fouling and loss of sterility |
| Flow Meters | Gas/liquid feed rates | Fast | Precise nutrient dosing and sparging control in fed-batch |
These signals keep the vessel stable. The next layer tells you more about what the cells are doing.
Advanced PAT Tools: Process Understanding
These tools sit on top of the classical layer and extend it. Raman and NIR only become useful once the chemometric models are in place. That’s the main trade-off: calibration effort versus real-time metabolite visibility that classical sensors can’t give you.
| Tool | Measurable Variables | Calibration Burden | Integration Mode | Best-Fit Formats (Cultivated Meat) |
|---|---|---|---|---|
| NIR Spectroscopy | Nutrients, metabolites, moisture | High (complex chemometric models) | In-line window/flow-through | Large-scale stirred-tank; high-density fed-batch |
| Raman Spectroscopy | Glucose, lactate, glutamine, ammonia, glutamate, TCD, VCD [2] | High (PLS regression; requires reference data) [2] | In-line immersion probe [2] | Stirred-tank; perfusion; pilot and production scale |
| Optical Density | Total cell density (TCD), turbidity | Low (simple linear correlation) | In-line | Seed trains and biomass expansion |
| Capacitance | Viable cell density (VCD), cell volume | Medium (cell-specific correlation) | In-line | Stirred-tank; microcarrier-based systems |
| Automated Metabolite Analysers | Specific metabolites, amino acids | Low (standard chemical calibration) | At-line (automated sampling/filtration) | Process development; large-scale stirred-tank validation |
Single-use bioreactors have limited ports, so probe count is constrained [6]. In practice, that means you can’t measure everything. You have to prioritise the signals that matter most for control and process understanding at your actual scale.
These trade-offs lead straight into the bioreactor-selection choices that follow.
Matching Monitoring Tools to Bioreactor Selection
Choose the bioreactor around the monitoring stack, not the other way round. Equipment selection and monitoring design need to happen together. That means vessel format, port count, and software integration are part of the same decision.
Start with CQAs and CPPs. Then map the sensors and vessel features those targets call for. Pick a vessel that can support the signals your process needs, both physically and through the control layer - temperature, pH, DO, off-gas, and viability among them. Once that list is set, bioreactor selection turns into a compatibility check instead of a guess.
The biggest hardware call here is single-use versus stainless steel. Single-use systems restrict probe count and lock calibration into the assembly, so each port has to justify its place. Stainless steel gives you more room for probes and makes sensor replacement easier, but it also brings SIP/CIP validation into the picture. After port count, exhaust handling becomes the next constraint, because gas removal gets harder as working volume increases.
At volumes above 2,000 L, check that the bioreactor can support off-gas monitoring [15]. In perfusion, check that the control system can ingest biocapacitance data for feed and harvest control [1]. In bigger vessels, exhaust handling and analytics provision need to be designed in from the start.
The last check is control system compatibility. A sensor is useless if the platform cannot read it, trend it, or act on it. Weak software integration can block the whole monitoring stack, even when the sensors themselves are fit for purpose [1].
Procurement gets simpler when vessel format and sensor compatibility are reviewed together. Cellbase helps cultivated meat teams compare bioreactors, port layouts, and sensor compatibility in one place.
Conclusion
Scale-up works when monitoring fits the biology, the control strategy, and the bioreactor format. At larger volume, that usually means pairing tight control of the culture environment with process analytics that can track what the cells are doing in real time.
The strongest monitoring stacks tend to combine capacitance for viable cell density, Raman or NIR for metabolite tracking, and inline pH plus dissolved oxygen sensors for environmental control. Those tools matter even more when they are connected to SCADA or MES, so the system can respond when the process starts to drift. At commercial scale, integrated PAT set-ups have been shown to cut deviation rates to less than 2% and shorten batch release timelines by up to 30% compared with more conventional campaigns [1].
That stack needs to be proven before moving into larger vessels. Validate it at pilot scale, build the models there, and only carry forward control settings that have already worked under process-relevant conditions. In practice, that also means sorting out sensor choice and software compatibility early, so the monitoring set-up can move with the process instead of slowing scale-up down later.
The same thinking applies to procurement. Cellbase helps cultivated meat teams compare bioreactors and culture systems, sensors, and compatible monitoring equipment in one place.
FAQs
When should I add PAT in scale-up?
Add PAT during scale-up once process parameters start to have a direct effect on culture stability and product quality.
Track key parameters continuously, including cell density, metabolites, and environmental conditions, to help keep the process consistent and support regulatory compliance.
How do I choose between Raman, NIR and capacitance?
It depends on what you need to monitor during scale-up.
- Raman is best when you need detailed molecular data and want to track multiple analytes in real time.
- NIR works for broad online monitoring, but it has seen less validation in cell culture and may need more calibration work.
- Capacitance is best for simple, hard-wearing online monitoring of viable cell concentration, though accuracy can drop during cell death phases.
Why can a probe fail at larger scale?
A probe can fail at larger scale because higher agitation, more vibration, and general wear put it under more mechanical stress. At that point, sensors that aren’t built for those conditions can get damaged.


