

Hvis du kun prøver den endelige afløb, går du glip af de strømme, der driver omkostninger, behandlingsbelastning og risiko for handelsaffald. For bioprocesingeniører og cellekulturteams er det rigtige udgangspunkt enkelt: kortlæg affald ved hvert procestrin, hold strømme adskilt, og log de samme kerndata for hver strøm.
Jeg vil koge artiklen ned til dette:
- Jeg har brug for et levende affaldsregister, ikke en engangsrapport
- Jeg bør kortlægge affald efter kilde: medieforberedelse, frøtræning, produktionsbioreaktor, høst, nedstrøms trin, CIP/SIP og forsyninger
- Jeg bør holde procesaffald, rengøringsaffald og forsyningsudløb adskilt, indtil data viser, at de kan kombineres
- Jeg bør registrere de samme kerneparametre for hver strøm: pH, ledningsevne, COD, BOD, TSS, saltbelastning, volumen og kontamineringsrisiko
- Jeg bør være særlig opmærksom på høj-COD bioreaktorudløb, celleholdige fraktioner, høj-salt klarede væsker, og ekstrem-pH CIP-strømme
- Jeg bør gennemgå kortet efter opskalering, medieændringer, perfusionsændringer, TFF-ændringer eller ny rengøringskemi
Nogle få punkter skiller sig straks ud.Produktionsbioreaktorens affald har normalt den højeste organiske belastning i anlægget. CIP/SIP-udledning kan svinge fra omkring pH 2,0 til 12,0. Og kontinuerlig perfusion kan ændre affaldet fra batch-toppe til en mere stabil daglig belastning, hvilket ændrer, hvordan jeg ville overvåge det.
Hurtig sammenligning
| Strømningsområde | Hovedbelastning | Hovedrisiko | Hvad jeg ville spore først |
|---|---|---|---|
| Medieforberedelse | Næringsstoffer og salte | Salt til afløb | pH, ledningsevne, saltbelastning |
| Frøtræning | Næringsstoffer, metabolitter, levedygtige celler | Biologisk klassifikation | KOD, BOD, TSS, kontaminationsrisiko |
| Produktionsbioreaktor | Brugt medie, celler, affald, mikrobærere | Organisk affald med høj styrke og celleindhold | KOD, BOD, TSS, ledningsevne |
| Høst / separation | Biomasse i opslæmning, opløste salte i filtrat | Faststoffer i en fraktion, salt i en anden | TSS for opslæmning; ledningsevne for filtrat |
| Nedstrømsbuffere | Salte og pH-skift | Høj ledningsevne, variabel pH | pH, ledningsevne |
| CIP / SIP | Kaustisk, syre, rengøringsmidler | Ekstrem pH og kemiske rester | pH, ledningsevne, faseadskillelse |
| Forsyninger | Opløste mineraler | Mineralbelastning til kloak | Ledningsevne, mineralbelastning |
Så hvis jeg vil have en affaldskarakteriseringsplan, der kan stå sig under idriftsættelse og opskalering (se vores guide om ops skalering af dyrkede kødprocesser), ville jeg starte ved enhedsoperationen, ikke udløbet, og jeg ville bruge ét datasæt på tværs af hver strøm.
sbb-itb-ffee270
Sådan kortlægges affaldsstrømme på tværs af anlægget
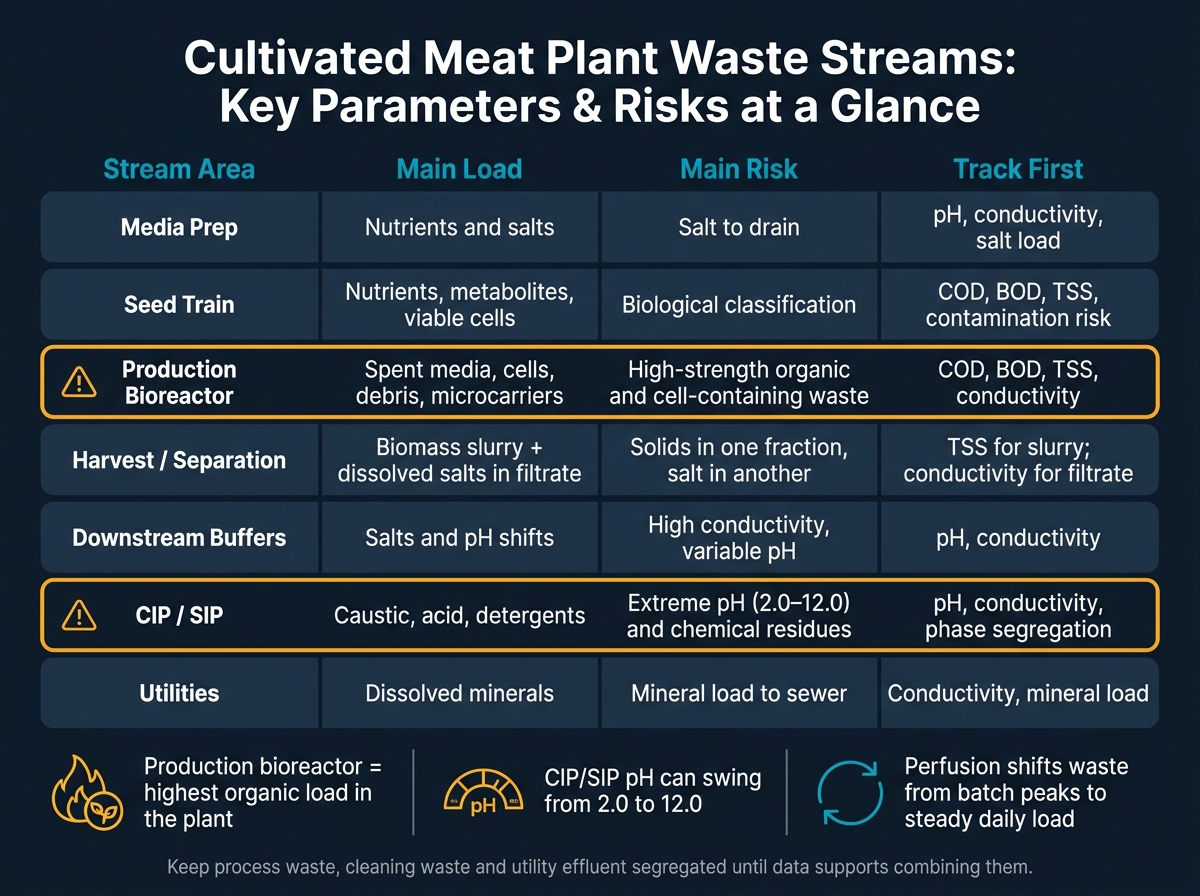
Affaldsstrømme fra dyrket kød-anlæg: Nøgleparametre & Risici i et overblik
Byg et affaldsregister fra procesflowdiagrammer
Start med dine procesflowdiagrammer (PFD'er) og arbejd gennem hver enhedsoperation i rækkefølge: medieforberedelse, frøtræning, produktionsbioreaktorer, høst, downstream-behandling og rengøring. Ved hvert trin skal du logge hvert outputpunkt. Det inkluderer hovedproduktstrømmen, men også hver sidestream og afløb. Dette er det kildespecifikke datasæt, du har brug for til karakterisering af strøm-for-strøm.
Når du har listet outputtene, skal du opdele dem i tre grupper: procesaffald (brugt medie, celledetritus, perfusionsblødning og filtrationsretentat), nyttestrømme (for eksempel kølevandsudblæsning), og rengøringsaffald (CIP og SIP-effluent). At holde disse grupper adskilt fra starten gør registret lettere at bruge, når du vælger behandlingsruter og kontrollerer overholdelse. Som minimum skal du registrere flow i m³ pr. batch og m³ pr. dag. Validér registret med pilot-skala kørsel, så volumen- og sammensætningsestimater kommer fra målte data, ikke gætteri.
Brug et standard karakteriseringsskema for hver strøm
Når registret er på plads, skal du bruge det samme skema for hver strøm. Den konsistens er det, der gør registret nyttigt. Hvis hver strøm logges på en anden måde, bliver sammenligning hurtigt rodet.
Det mindste datasæt for hver post skal inkludere kilden, hvilket betyder den specifikke enhedsoperation, fysisk form, estimeret volumen, nøglebestanddele og kontaminationsrisiko, såsom levedygtige celler eller rengøringskemikalier. Du skal også bruge de parametre, der anvendes til at vælge behandlingsmuligheder og opfylde britiske krav til handelsaffald: pH, ledningsevne, COD, BOD, TSS og saltbelastning.
| Felt | Enhed / Format | Primær anvendelse |
|---|---|---|
| Kilde | Enhedsoperation navn | Sporbarhed og adskillelse |
| Fysisk form | Væske / opslæmning / fast stof | Valg af behandlingsudstyr |
| Volumen | m³ per batch; m³ per dag | Lagerstørrelse og tilladelsesansøgninger |
| Vigtige bestanddele | Næringsstoffer, salte, proteiner | Genopretning af næringsstoffer eller bortskaffelsesgrænser |
| Forureningsrisiko (levedygtige celler, rengøringskemikalier) | - | Biosikkerhed og tilladelsesoverholdelse |
| pH | - | Behandlingsvalg og overholdelse |
| Ledningsevne | mS/cm | Saltbelastningsindikator |
| COD | mg/L | Organisk belastning til behandlingsdimensionering |
| BOD | mg/L | Biologisk nedbrydelighedsvurdering |
| TSS | mg/L | Håndtering af faste stoffer og overholdelse |
| Saltbelastning | kg/dag | Udløbstilladelse og forsyningsfakturering |
Brug af det samme skema på tværs af alle strømme holder poster sammenlignelige og gør beslutninger om behandling og overholdelse meget lettere at forsvare.
Hvordan leverandør- og indkøbsdata kan forbedre karakteriseringen
Når registret viser, hvor hver strøm kommer fra, kan leverandørdokumenter udfylde hullerne. Leverandørdokumentation er en kilde til affaldskarakteriseringsdata, ofte hentet gennem et dedikeret indkøbslag. Brug dokumenter fra udstyrs- og medieleverandører til at stramme affaldsestimater og opbygge prøveudtagningsplaner. Træk disse data tidligt, under indkøb snarere end efter installation, og registret starter med realistiske tal i stedet for grove antagelser.
Karakterisering af upstream- og produktionsaffaldsstrømme
Denne fase af karakteriseringen viser, hvor det primære behandlings- og overholdelsespres begynder at opbygge sig.Fra dette punkt skifter fokus til de opstrøms og produktionsstrømme, der står for størstedelen af anlæggets organiske og biologiske belastning.
Medieforberedelse og frøtræningsaffald
Medieforberedelsesaffald er normalt næringsrigt, men lavrisiko fra et biologisk synspunkt, fordi celler endnu ikke er blevet introduceret. I praksis skaber medieforberedelse nogle få klare affaldsstrømme: off-spec partier, beholder skylninger og steril filtrationsretentat. Disse strømme indeholder resterende næringsstoffer og salte, men den biologiske risiko forbliver lav, fordi der ikke er tilstedeværende celler.
De vigtigste analytiske kontroller på dette stadium er pH, ledningsevne, COD, BOD, TSS og saltbelastning. Ledningsevne er særlig vigtig, fordi basale medier er saltrige. Selv en skyllefraktion kan indeholde nok opløste salte til at påvirke handelsudledningsgodkendelse.
Frøtræningsaffald ser ved første øjekast lignende ud, men risikoprofilen ændrer sig, når celler er i systemet.Brugt ekspansionsmedie indeholder resterende næringsstoffer samt metaboliske biprodukter såsom laktat og ammoniak, så dets organiske belastning er højere end medieforberedelsesaffald. Frøtræningsaffald kræver også separat karakterisering, fordi det indeholder levedygtige dyreceller, ikke kun opløste mediekomponenter.
Belastning og risiko øges igen på produktionsskala.
Produktionsbioreaktor-effluent og perfusionsblødning
Produktionsbioreaktorer producerer de højeste belastningsaffaldsstrømme i anlægget. Batch brugt medie og tømning af beholdere bærer meget høj organisk belastning, salte og celleholdige faste stoffer. TSS er drevet af dyreceller og, hvor det anvendes, mikrobærere. I de fleste anlæg er dette strømmen, der danner grundlaget for adskillelse, inaktivering og behandlingsstørrelse.
Perfusionssystemer tilføjer et andet lag. Perfusionsblødning er lavere pr. tidsenhed, men den er kontinuerlig.Avancerede systemer bruger centrifuge-baseret perfusion og mediefornyelse, som reducerer det samlede affaldsvolumen, mens det resterende spildevand koncentreres [2][4]. Både batch- og perfusionsopsætninger kræver et valideret inaktiveringstrin før udledning eller genbrug [1].
Sammenligningstabel: medieforberedelse, frøtræning og produktionsbioreaktor affald
| Strømgruppe | Kilde | Fysisk form | Volumen | KOD/BOD Belastning | Ledningsevne / Saltbelastning | TSS Profil | Kontaminationsrisiko | Overvågningsfrekvens |
|---|---|---|---|---|---|---|---|---|
| Medieforberedelse | Off-spec medie, skylninger, filterretentat | Væske | Moderat | Lav til moderat (ubrugte næringsstoffer) | Moderat til høj | Lav (filtreret) | Lav - kun kemisk/næringsstof | Per batch |
| Frøtræning | Brugt ekspansionsmedie, beholder skylninger | Væske / opslæmning | Lav | Moderat (metaboliske biprodukter) | Moderat | Moderat (celler til stede) | Moderat - levedygtige dyreceller | Per kørsel |
| Produktionsbioreaktor | Batch brugt medie, beholder tømmes, perfusionsblødning | Væske / opslæmning | Høj | Meget høj | Høj (metabolitter, salte) | Høj (celler, affald, mikrobærere) | Høj - levedygtige dyreceller | Kontinuerlig |
Høst, downstream-behandling og rengøringsaffald
Efter dyrkning bliver affaldet meget mere blandet.pH, ledningsevne og faste stoffer kan ændre sig markant fra en strøm til den næste, så det er en dårlig idé at samle alt sammen. Forskellige fraktioner har ofte brug for forskellige behandlingsruter. Brug de samme kilde-, volumen- og forureningsfelter, der blev defineret tidligere, men anvend dem på fraktionsniveau.
Høst og downstream-behandlingsaffald efter fraktion
Høst producerer mindst to affaldsfraktioner, og de bør logføres separat.
Den første er høstslurry. Dette er den koncentrerede blanding af dyrkede kød celler, brugt medie og, hvor det anvendes, stilladsfragmenter, der er genvundet fra bioreaktoren. Det, der adskiller det fra upstream-affald, er den partikulære biomasse. I denne strøm er TSS og COD hovedsageligt drevet af cellefaste stoffer, ikke kun opløste organiske stoffer.Hvis tangential flow filtration (TFF) eller centrifugering bruges til at adskille biomasse fra den flydende fase, skubber kagen, retentatet eller centratet disse forskelle endnu længere.
Den klarerede væske, eller centrat/filtrat, der er tilbage efter separation, er en anden strøm. Den har normalt lav TSS, men den bærer stadig opløste salte fra mediet, så ledningsevnen forbliver høj. Denne fraktion bør karakteriseres for sig selv og gennemgås for genvindingspotentiale før behandling. Klareret væske kan stadig være egnet til næringsstofgenvinding eller andre genbrugsruter.
Når biomassen er fjernet, ændres affaldsprofilen. Hovedproblemet er ikke længere faste stoffer. Det bliver saltbelastning og pH-kontrol.
Efterfølgende behandling tilføjer flere fraktioner. Buffere og skylleløsninger fra oprensningstrin har normalt lav TSS, høj ledningsevne og variabel pH, afhængigt af de anvendte salte.I praksis er disse strømme mest et problem med saltbelastning og pH-styring, så de har brug for deres egen post i affaldsregistret.
CIP, SIP og forsyningsrelateret spildevand
Rengøringsstrømme tilføjer en separat kemisk belastning. CIP-strømme er kendetegnet ved ekstreme pH-svingninger, høj ledningsevne fra saltbelastninger og rester af rengøringsmidler eller desinfektionsmidler [2][3] . Den største overholdelsesrisiko fra CIP-spildevand er pH-svingning. Disse strømme bør overvåges i realtid på afløbslinjer og udlignes før udledning eller behandling, snarere end at blive blandet direkte med produktkontakt-affald.
Forsyningsstrømme er igen forskellige. De tilføjer mest mineralbelastning, ikke biologisk belastning. Kedel- og køletårnsblowdown bør holdes adskilt fra produktkontakt-affald, medmindre stedets spildevandsplan allerede har gennemgået og godkendt den rute.
Sammenligningstabel: høstslurry, downstream buffere og CIP-spildevand
| Strøm | Hovedsammensætning | Vigtige risikofaktorer | Sandsynligt pH-område | Faststofniveau | Saltbelastning | Analytiske prioriteter | Håndteringsmetode |
|---|---|---|---|---|---|---|---|
| Høstslurry / Centrifugekage | Dyrkede kød celler, proteiner, brugt medium, mulige stilladsfragmenter | Høj COD, høj TSS, organisk belastning | Nær neutral | Meget høj | Moderat | COD, BOD, TSS, nitrogen | Adskil; genvind biomasse eller håndter som højstyrke organisk affald |
| Klareret væske (Centrat / Filtrat) | Opløste næringsstoffer, metabolitter, resterende vækstfaktorer | Høj opløst COD og BOD, høj ledningsevne | Variabel | Lav | Høj | COD, BOD, ledningsevne | Adskil; vurder genvindingspotentiale før behandling |
| Downstream Buffers / Skylleløsninger | Salte og andre rensningskemikalier | Høj ledningsevne, variabel pH, saltbelastning | Variabel | Meget lav | Meget høj | pH, ledningsevne | Adskil; juster pH før kombination med andre strømme |
| CIP / SIP Spildevand | Kaustisk, syre, rengøringsmidler, desinficeringsløsninger, organisk overførsel | Ekstreme pH-svingninger, kemiske rester, høj ledningsevne | 2.0 – 12.0 [2][3] | Meget lav | Meget høj | pH, ledningsevne, rengøringsmiddelrester | Adskil efter fase; udlign og neutraliser før udledning |
| Forsyningsspildevand (Kedel / Køleblowdown) | Opløste mineraler | Mineralbelastning, højere ledningsevne | Variabel | Meget lav | Høj | Ledningsevne, mineralbelastning | Rute separat; må ikke kombineres med biologiske spildevandsstrømme |
Disse forskelle former både adskillelse og behandling. Høstslurry kræver stærk organisk behandling. Klarificeret væske kan være egnet til biologisk behandling eller næringsstofgenvinding. Nedstrømsbuffere har brug for saltstyring og pH-justering. CIP-spildevand kræver udligning og neutralisering.Hvis disse strømme kombineres før det rette kontroltrin, kan ét behandlingssystem hurtigt blive overbelastet, og det kan føre til overholdelsesproblemer.
Brug karakteriseringsdata til adskillelse, behandling og overholdelse i Storbritannien
Omdan målinger til behandlingsbeslutninger
Når strømme er kortlagt, omdannes dataene til klare adskillelses- og behandlingsregler. En måling har ingen værdi, medmindre den ændrer, hvad stedet gør næste gang. Tabellen nedenfor forbinder hver parameter med den handling, den skal udløse.
| Parameter | Hvad det signalerer | Sandsynlig behandlingsrespons |
|---|---|---|
| pH | Neutraliseringsbehov | Udligne og neutralisere før kombination af strømme |
| Ledningsevne / Saltbelastning | Egnethed til udledning af handelsaffald | Adskil høj-salt strømme; vurder egnethed til udledning til kloak |
| KOD / BOD | Egnethed til biologisk behandling; organisk styrke | Strømme med høj styrke kan kræve forbehandling før biologisk behandling |
| TSS | Krav til fjernelse af faste stoffer; behov for slamhåndtering | Affugt eller filtrer før udledning; håndter fjernede faste stoffer separat |
Kombiner ikke strømme med høj og lav styrke, før hver er blevet karakteriseret, og den kombinerede belastning er blevet vurderet.
Hvor rekombinante proteiner eller konstruerede organismer er til stede, inaktiver strømmen, før den kombineres med generelt spildevand [1].
Strømme med høj styrke bør også screenes for genvinding før behandling. Hvis genvinding ikke er mulig, send dem til den mindst intensive overensstemmende rute.
Etabler en praktisk overvågnings- og gennemgangsplan
Brug de samme strøm-niveau data til at kontrollere, om de valgte ruter stadig giver mening under idriftsættelse. Baseline-prøvetagning bør dække hver større strøm på proces-trin niveau, ikke kun ved udløbet. Mål de centrale parametre under idriftsættelse, og gentag derefter prøvetagning på mindst tre på hinanden følgende batches for at definere det normale område. Store udsving i COD eller ledningsevne peger ofte på en uregistreret procesændring.
Trigger-baserede gennemgange er vigtige.Gennemgå affaldskortet, når medieomformulering finder sted, herunder en overgang til dyrefri komponenter, når bioreaktorer opskaleres, eller når rengøringskemi ændres. En fabrik karakteriseret på én skala vil ikke altid have et præcist billede efter overgangen til større produktionsbeholdere.
For faciliteter, der bruger tangential flow-filtrering eller kontinuerlig perfusion, skal overvågningen indstilles omkring steady-state belastninger i stedet for batch-toppe. Kontinuerlig høst skaber en mere konsistent daglig affaldsprofil, men det betyder også, at enhver afvigelse i celletæthed eller mediesammensætning passerer ind i affaldsstrømmen kontinuerligt i stedet for at fremstå som en engangsbegivenhed.
Konklusion: det minimumsdatasæt, som hvert dyrket kød-anlæg bør opretholde
Slutproduktet af karakterisering er ikke en rapport. Det er et levende register, der driver håndteringsbeslutninger.Vedligehold et affaldsregister for hver strøm med:
- kildeproces trin
- affaldsklasse
- volumen
- kontaminationsrisiko
- pH
- ledningsevne
- KOD
- BOD
- TSS
- saltbelastning
- tildelt rute
Strømme skal forblive adskilte, indtil karakteriseringsdata understøtter at kombinere dem. Højrisikostrømme, især dem med inaktiveringskrav, ekstrem pH eller meget høj organisk belastning, har brug for deres egen dokumenterede håndteringsvej. At holde disse data opdaterede og gennemgå dem efter hver større procesændring er det, der adskiller en overholdende facilitet fra en, der kun finder et behandlingsproblem, når det når afløbet.
Ofte stillede spørgsmål
Hvorfor ikke kun tage prøver fra det endelige afløb?
Det er ikke nok kun at tage prøver fra det endelige afløb.Det skjuler hvor affald genereres og hvad der er i det i hele processen med dyrket kød.
Et trin-for-trin affaldskort giver teams et meget klarere billede. Det hjælper med at lokalisere kontaminationshændelser, næringsstofudtømning og procesbiprodukter, når de opstår, ikke efter at alt er blandet sammen nedstrøms.
Det gør også rutinemæssig overvågning langt mere nyttig. På hvert trin kan teams spore:
- pH
- Ledningsevne
- KOD
- BOD
- TSS
- Saltbelastning
Det er vigtigt for både overholdelse og den daglige anlægsydelse. Når du ved, hvilken strøm der driver belastningen, er det meget lettere at fejlfinde, justere driften og undgå at sende undgåelige problemer til den endelige afløb.
Hvilke affaldsstrømme skal adskilles først?
Først skal flydende og faste affaldsstrømme adskilles.
Ikke-genanvendt kulturmedie og rengøringsaffald skal gå i den flydende spildevandsstrøm til behandling.
Fast affald, inklusive ikke-spiselige eller ikke-bionedbrydelige mikrobærere og stilladsrester, skal fjernes under høsten. Dette hjælper med at forhindre forurening, opretholde processeffektivitet og støtte genvinding af biprodukter eller mediekomponenter.
Hvor ofte skal affaldsregisteret opdateres?
Opdater affaldsregisteret mindst efter hver produktionskørsel, hvad enten det betyder dagligt eller en gang pr. bioreaktorkampagne. Opdater det igen, hver gang en procesændring eller rengøringsændring kan ændre affaldsstrømmen.
På den måde forbliver dine optegnelser for flydende, fast og blandet affald aktuelle, både for volumen og for målte egenskaber såsom pH, ledningsevne, COD/BOD, TSS og saltbelastning.


