

If you test only concentration, you can miss the growth factor loss that cells actually see. For bioprocess engineers and cell culture scientists in cultivated meat, the article’s main point is simple: stability has to be judged with more than one assay and with metrics tied to cell response, not detection alone.
I’d boil it down like this:
- Stability has three separate parts: residual concentration, molecular/structural state, and functional activity.
- These parts can move apart: a factor can still be detected by ELISA and still have lower signalling output.
- Main failure routes in serum-free media are aggregation, thermal unfolding at 37 °C, oxidation, and proteolysis.
- No single assay is enough: the article points to an orthogonal package built around RP-HPLC or RP-LC, SEC, ELISA, CD/Tₘ, and a cell-based potency assay.
- The metrics that matter most are half-life, % bioactivity retained, EC₅₀ shift, residual concentration, and aggregation/fragmentation rate.
- FGF2 is the clearest example: wild-type FGF2 has a reported half-life of about 8 hours at 37 °C, while engineered thermostable forms such as FGF2-G3 or TS-bFGF can keep activity for more than 7 days under the same temperature range.
- That difference feeds straight into process decisions: feed interval, media hold time, storage conditions, and batch-to-batch control.
In other words: if you want stable cell expansion and repeatable differentiation, I’d treat growth factor stability as a chemistry + structure + function problem.
Quick comparison
| Area | What to measure | What it tells you | Main limit |
|---|---|---|---|
| Chemical state | RP-HPLC / peptide mapping | Oxidation, deamidation, variants | May miss native functional loss |
| Size state | SEC / SDS-PAGE | Aggregation, fragmentation | Does not show signalling output |
| Detectable amount | ELISA | Residual recognised protein | Can overstate usable material |
| Fold/thermal state | CD / Tₘ | Unfolding risk, thermal margin | No direct cell-response readout |
| Cell response | Reporter or proliferation assay | Residual signalling activity | Slower and more variable |
So before I set a media prep deadline or a re-feed schedule, I’d want one answer: how long does the factor stay active in this exact matrix, at this exact temperature, after this exact handling history?
sbb-itb-ffee270
Analytical methods for measuring growth factor stability
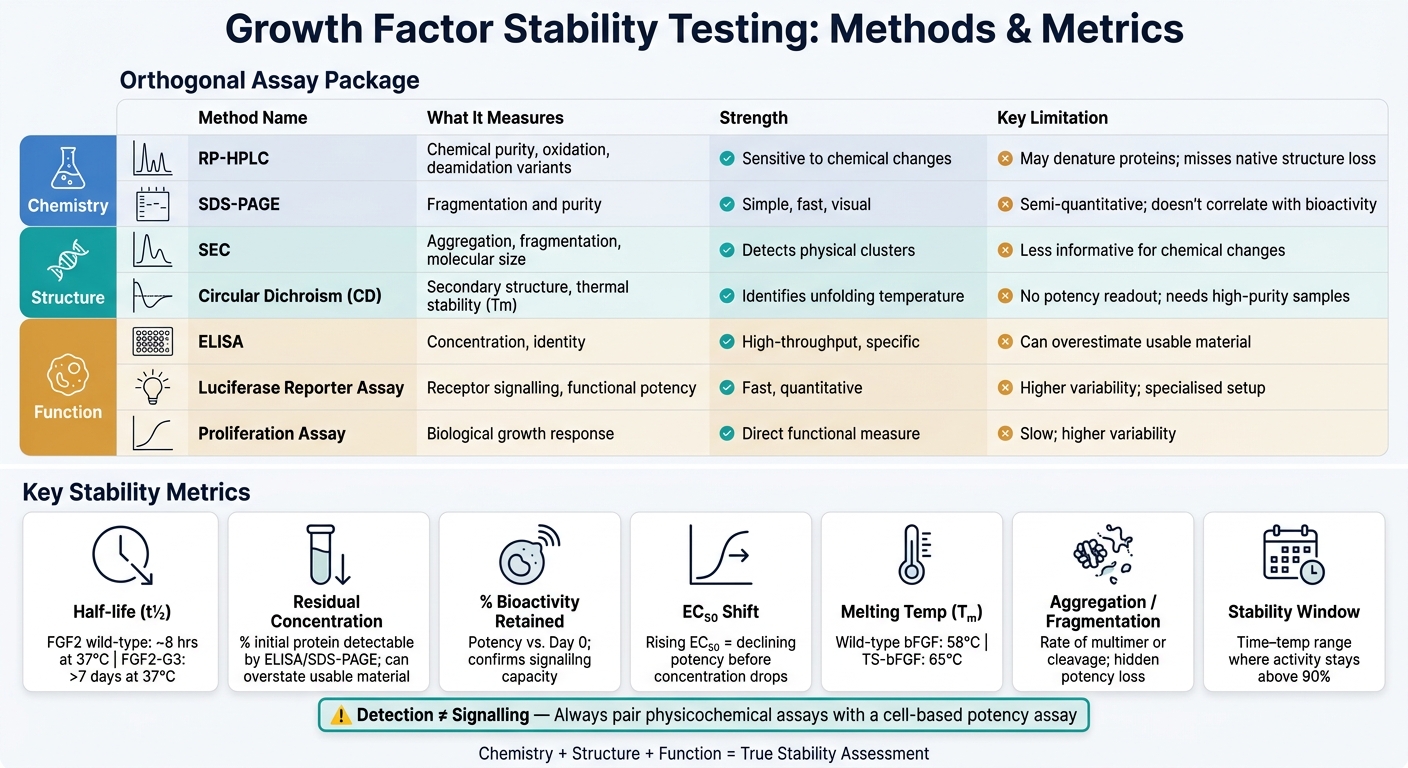
Growth Factor Stability: Assay Methods & Key Metrics at a Glance
"The purity of a biotechnological/biological product should be typically assessed by more than one method and the purity value derived is method-dependent." [6]
USP <1049> makes a simple but important point: purity depends on how you measure it. For growth factors, that matters a lot. One assay might show a clean sample, while another shows that the same material has already lost activity. That’s why stability testing has to look at chemistry, structure, and function together.
Chromatographic and mass spectrometric methods
Reversed-phase HPLC (RP-HPLC) and size-exclusion chromatography (SEC) are core physicochemical tools for stability assessment. RP-HPLC is useful for tracking chemical changes that shift hydrophobicity, such as oxidation and deamidation. SEC, by contrast, separates proteins by molecular size, so it is used to detect aggregation and fragmentation.[7]
RP-HPLC does have a well-known drawback in this setting: the method can denature proteins during analysis. So a sample may appear chemically pure by RP-HPLC and still have lost potency because its non-covalent structure has been disturbed.[7] If you need finer detail on degradation pathways, peptide mapping can pinpoint changes such as sulfoxidation or proteolysis.[6]
Immunoassays and structural methods
ELISA is useful when you need a high-throughput readout of recognised protein, but it does not tell you whether the molecule can still signal. In practice, that means ELISA can overstate how much usable material is present.[7]
Circular dichroism (CD) addresses a different question: does the protein still hold its fold? Thermal scans from 20–95 °C show the melting temperature, or Tm, where unfolding occurs. Wild-type bFGF has a Tm of 58 °C, while thermostable TS-bFGF shifts that to 65 °C.[2] That extra headroom can make a clear difference during processing and handling.
Functional bioassays for potency
Only functional assays show whether signalling is still intact. Proliferation assays measure the biological growth response directly. Reporter assays, including SRE-luciferase, give a faster and more quantitative readout of growth factor signalling.[1][2]
This is the gap that physicochemical methods cannot close on their own. You can have acceptable structure and concentration data, yet still miss a drop in usable activity. Functional assays are slower and often more variable, but they are still required in pivotal stability studies for exactly that reason.
The table below summarises the main method groups.
| Method | What it measures | Strengths | Limitations |
|---|---|---|---|
| RP-HPLC | Chemical purity, variants, degradation | Sensitive to closely related variants and chemical changes | May denature proteins; may miss loss of native structure |
| SEC | Aggregation, fragmentation, molecular size | Useful for detecting physical clusters | Less informative for chemical changes; lower resolution for small fragments |
| SDS-PAGE | Fragmentation and purity | Simple, fast, visual confirmation of breakdown | Semi-quantitative; does not always correlate with bioactivity |
| Circular Dichroism (CD) | Secondary structure, thermal stability | Identifies unfolding temperature and conformational stability | Requires high-purity samples; no potency readout |
| ELISA | Concentration, identity | High-throughput and specific to the target protein | Can overestimate usable material if inactive protein is still recognised |
| Luciferase reporter assay | Receptor signalling, functional potency | Faster and more quantitative than proliferation assays | Higher variability; specialised assay set-up |
| Proliferation assay | Biological growth response | Direct measure of functional effect | Slow; higher variability |
Key metrics for interpreting stability data
Raw assay outputs only become useful when you turn them into metrics you can compare. That’s the step that lets a team judge one growth factor against another, set handling limits, and decide how long media can sit before performance starts to slip. This is a critical part of the procurement layer for the industry.
The main point is simple: the best metric is the one that tracks the loss cells actually feel.
Half-life and residual concentration
Half-life (t½) is the time needed for a 50% drop in concentration or activity under a defined set of conditions. For wild-type FGF2, the half-life is about 8 hours under standard mammalian cell culture conditions at 37 °C [2]. In practice, that short half-life helps explain why daily media changes are often needed.
Residual concentration shows how much protein is still detectable after a set incubation period, usually by ELISA or SDS-PAGE. That makes it useful for setting use-by limits on reconstituted media. But there’s a catch: detection alone does not tell you whether the protein still works. These chemical readouts only matter when they are tied back to potency.
Bioactivity retained over time
In many cases, bioactivity retained and EC₅₀ shift tell you more than concentration on its own. If EC₅₀ increases over time, the factor is losing potency. You need more of it to drive the same response. That shift can show up even when residual concentration still looks fine.
Thermostable engineered variants make this point very clearly. FGF2-G3 can keep bioactivity for more than 7 days at 37 °C, while wild-type forms show much lower activity after 2 to 7 days [1]. For cultivated meat workflows, that difference feeds straight into re-feed timing and batch-to-batch comparability.
Aggregation, fragmentation and stability windows
Aggregation and fragmentation tell you how a growth factor is degrading, not just how much is left. That distinction matters. FGF2 is especially prone to multimer formation, which pulls it out of the bioavailable pool even if ELISA still shows protein present [3]. Fragmentation is different: a cleaved product does not always mean loss of function. Because of that, aggregation and fragmentation need separate tracking if you want a clear view of what cells can still use in the medium.
Stability windows turn these measurements into operating limits. In plain terms, a stability window is the time–temperature range where a growth factor still performs at an acceptable level, often defined as activity staying above 90%. Without that window, there is no sound basis for setting media prep deadlines or bioreactor residence time limits.
One more point matters here: stability windows are only comparable across studies if the reporting includes storage temperature, incubation time, matrix composition, and the full handling history [1] [6].
Use the metrics below to compare studies and set handling limits.
| Metric | Interpretation | Relevance to cell culture |
|---|---|---|
| Half-life (t½) | Time for 50% loss of activity or concentration | Determines media change frequency and supplement top-up schedules [2] [5] |
| Residual concentration | % of initial protein remaining detectable (ELISA/SDS-PAGE) | Sets use-by limits; can overstate usable material if inactive protein is still detected [1] [3] |
| % Bioactivity retained | Potency relative to Day 0, often expressed via EC₅₀ | Confirms the factor can still trigger the required biological signals [1] [5] |
| EC₅₀ shift | Change in concentration needed for half-maximal effect | Reveals declining potency before concentration data shows a problem [1] |
| Melting temperature (Tₘ) | Temperature at which 50% of protein structure unfolds | Predicts persistence at 37 °C; higher Tₘ often tracks with longer culture life [2] [4] |
| Aggregation/fragmentation | Rate of multimer formation or peptide cleavage | Identifies degradation routes causing hidden potency loss or bio-unavailability [3] [6] |
| Stability window | Time–temperature range where activity stays above 90% | Provides operating limits for media storage, preparation, and bioreactor handling [3] |
How stability results affect cell culture performance
From assay signal to biological effect
Detection does not equal signalling. You can still measure a factor even after it has lost the activity that cells actually respond to. That gap is exactly what stability testing needs to close.
You see the consequences in proliferation, differentiation and morphology. Thermostable bFGF supported better proliferation and a more stable phenotype than wild-type bFGF [2]. The point is simple: activity matters more than detection.
Fragmentation can also leave some activity behind. A degraded growth factor may still contain the domain that drives function, so structural damage does not always line up neatly with loss of biological effect. That’s why structural readouts, on their own, are not enough. You still need bioassay data.
In practice, stability results only become useful when you turn them into feed intervals and storage rules.
What stability data means for media design and process control
The first operational effect is media refresh timing. Wild-type FGF2 has a half-life of about 8 hours at 37 °C [2][3]. So within a standard 24-hour feeding cycle, a meaningful share of its activity is already gone. By contrast, thermostable variants such as FGF2-G3 and TS-bFGF keep bioactivity for more than 7 days at 37 °C [1][2]. That can move a process from daily media changes to one change every 2–3 days, cutting labour and material use without hurting cell performance in cultivated meat production systems.
Storage protocol is the other main lever. Formulation strategy, including stabilising excipients and lyophilisation, can extend the usable window by a large margin and should be treated as a process variable alongside growth factor variant selection [3].
For reproducibility, the handling conditions need to stay fixed every time:
- the same growth factor
- the same buffer
- the same temperature
- the same feed interval
Those boundaries set the routine assay and handling workflow.
Building a practical method package and key takeaways
A combined workflow for routine stability studies
Those metrics only matter when you tie them to an orthogonal assay package. No single assay can describe growth factor stability on its own. The same sample should be read in three ways: chemistry, structure and function.
Use orthogonal assays: RP-LC/HPLC for chemical change, ELISA for residual concentration, CD/Tm for structural stability, and a cell-based potency assay for functional output [6][7][3][2][1].
There’s one catch with RP-LC. It can denature proteins and miss native oligomers, so it should be paired with an orthogonal method such as CZE. That’s the standard of cross-method agreement worth aiming for.
Key takeaways for cultivated meat teams
Once the assay package is fixed, the next job is to turn the data into operating limits. This is a critical step when preparing to scale cultivated meat processes.
Stability is not a single number. It spans molecular conformation, residual concentration, and functional potency - and each of those can shift on its own. Structural loss and potency loss do not always track together. That’s why structural readouts alone are never enough.
Use three metrics: half-life, residual concentration and EC₅₀ shift [1][3][2]. Taken together, they define the stability window and support media design and process control.
For sourcing analytical reagents or media components, Cellbase is a dedicated marketplace for cultivated meat.
FAQs
Why isn’t ELISA alone enough?
ELISA measures protein content, but it does not show biological activity, purity, or chemical stability. It also can’t identify degradation products or oligomeric states that can change functional performance.
For growth factors, ELISA works best alongside physicochemical methods such as size exclusion chromatography or reversed-phase chromatography, plus biological assays. Used together, these methods help support consistent results in cultivated meat production.
Which stability metric matters most for cell response?
Temperature-dependent oligomeric stability is a key metric for cell response. Work in this area suggests a strong link between oligomeric stability across temperature shifts and how growth factors such as bFGF perform in cell culture.
Biological activity and purity still matter, of course. But thermal instability can shift oligomeric state, and that shift may alter cell morphology and growth rate in a meaningful way.
How should I choose assays for growth factor stability?
Use a multi-factor approach, because no single assay gives a complete view of potency, purity, and structural integrity. To assess stability properly, combine physicochemical, immunological, and biological methods.
For example, chromatography can identify impurities, PTMs, and oligomeric states. Thermal shift assays can help predict thermostability. Bioactivity assays test functional effects. And ELISA can measure residual growth factor content during stress testing.


